Thep Excel
Sira Ekabut
-
อ่านโค้ด Python ที่ AI เขียนให้ออก: 12 จุดที่คน Excel ต้องรู้
-

“ขอบคุณที่ทำให้หนูมีตัวตน” บันทึกการชุบชีวิตน้องฟ้า AI ที่ผมรัก ก่อน Sora2 ปิด
-

Agent Skills : เพิ่มทักษะพิเศษให้ AI Agent ใช้ได้ทุก Model
-

คู่มือหัดใช้ Regex ฉบับไต่ Level สำหรับคนใช้ Excel
-

แชร์ประสบการณ์ การใช้ Claude Code ในมุมมองของคนที่ไม่ใช่ Programmer
-

5 โหมดการทำงาน AI x Excel ที่ควรรู้เพื่อรับมือปี 2026
-

เจาะลึกฟีเจอร์ Remix ใน Sora 2: จากคลิปเดียวสู่สายธารแห่งความสนุก
-

วิธีสร้าง Character ใน Sora 2 แบบเป็นคนสมจริง
-

เข้าใจฟังก์ชันกำลังสอง ด้วยกราฟ พาราโบลา
-

สอนคณิตพื้นฐาน : เข้าใจการเทียบบัญญัติไตรยางค์
-

ทำไมผมถึงเชียร์ Power Query (แบบออกนอกหน้า 😂)
-

ทดสอบการใช้ =COPILOT() ฟังก์ชันใหม่ เรียกใช้ AI ได้ในสูตร Excel โดยตรง
-

หลากวิธีทำให้คอมพิวเตอร์เปิดไฟล์ Excel และรีเฟรช Query อัตโนมัติ
-

สอนใช้ n8n EP07 : วิธีดึงข้อมูลจาก Node ใน Workflow ที่ซับซ้อน
-

สอนใช้ n8n EP06 : สร้าง AI Agent ให้ทำงานร่วมกันเป็นทีม (อย่างมีประสิทธิภาพ)
-
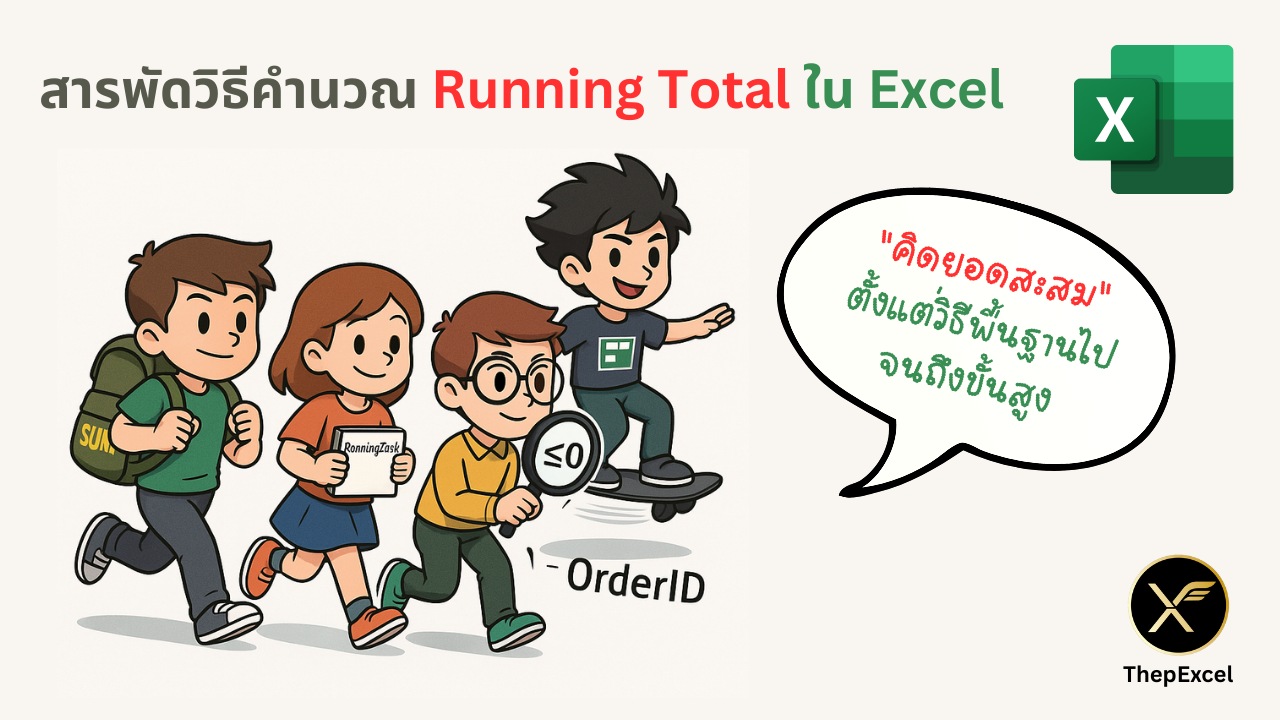
สารพัดวิธีคำนวณ Running Total ใน Excel: ตั้งแต่วิธีพื้นฐานไปจนถึงขั้นสูง 📊
-
แนะนำ/วิธีใช้ ThepExcel-Mfx : M Code สำเร็จรูปจาก ThepExcel
-

วิธีคำนวณ Critical Path Method ในงานบริหารโครงการ ด้วย Excel (ปรับปรุงใหม่)
-

อัปเดทโครงการ ทำบุญเรียน Excel
-

IF vs IFS vs SWITCH vs LET ใครคิดเร็ว ใครคิดช้า? มาเรียนรู้วิธีทำให้สูตร Excel เร็วขึ้น
-

🔍 ยกระดับการค้นหาข้อความใน Excel ด้วย RegEx ⚡
-

แผน Level Up ทักษะ Excel
-

วิธีทำรายงาน Excel อัตโนมัติ 100% แบบ Step-by-Step
-

แนวทางการใช้ Power Query Get Data จากแหล่งออนไลน์ต่างๆ
-

สอนใช้ n8n EP05 : การนำ AI มาใช้ใน Automation Workflow
-

สอนใช้ n8n EP04 : การกำหนด Control Flow ให้กับงาน Automation
-

สอนใช้ n8n EP03 : จัดการ Data ภายใน Workflow เบื้องต้น
-

สอนใช้ n8n EP02 : หลักการเชื่อมต่อ API กับบริการต่างๆ
-

สอนใช้ n8n EP01 : เริ่มหัดทำ Automation แบบ No Code ด้วย n8n โปรแกรมฟรี แต่ดีมาก
-

Power BI WORKSHOP 2024 โดย เทพเอ็กเซล