ThepExcel Logo
  • บทความ
    • Excel
      • Excel ทั่วไป
      • Excel Pivot Table
      • Excel Power Pivot
      • Power Query
      • Excel Array Formula
      • Excel VBA
      • Excel for Business
      • Excel and Maths
      • ฟังก์ชัน Excel ทั้งหมด
    • Power BI
      • Power Query
      • Data Model
      • DAX Formula
      • Power BI Report
    • Coding
      • Excel VBA
      • Python
      • Power Query M Code
    • Highlights : บทความแนะนำ
    • คลิปวีดีโอ
  • อบรม
    • อบรมลูกค้าองค์กร
    • คอร์สออนไลน์ SkillLane
    • แนะนำวิทยากร
    • Excel/Power BI Skill Map
    • Quiz
  • Shop
    • คอร์สออนไลน์
    • สินค้าทั้งหมด
    • หนังสือเล่ม
    • E-Book
    • Cart
  • Download
    • Download ไฟล์จากเทพเอ็กเซล
    • ThepExcel-Mfx : M Code สำเร็จรูป
    • Date Table สำเร็จรูป
    • กราฟ My Skill
    • github.com/ThepExcel
  • รวม Link
    • รวม Link สอน Excel & Power BI ทั้งไทยและเทศ
    • รวม Link สอน Python / Programming
    • หนังสือแนะนำ
    • Facebook ThepExcel
    • YouTube ThepExcel
    • DAX Formatter
  • Contact
    • แนะนำ เทพเอ็กเซล (Thep Excel)
    • แนะนำวิทยากร : อาจารย์ ศิระ เอกบุตร (ระ)
    • นโยบายการคุ้มครองข้อมูลส่วนบุคคล (Privacy Policy)
  • Facebook
  • YouTube

การสร้างกราฟแผนภูมิใน Excel ตอนที่ 2

Categories 📂

Excel Chart & Visualization

Tags 🏷️

combo, format, graph

ต่อจากตอนที่แล้ว ซึ่งผมได้เกริ่นไปแล้วว่าการสร้างกราฟที่ดี มีอยู่ 5 ขั้นตอน ซึ่งเรากำลังพูดถึงขั้นตอนที่ 4 คือการ Customize ปรับแต่งกราฟ ในบทความนี้ผมจะขอพูดเรื่องการปรับแต่งกราฟต่อเลยครับ

การปรับ Format สี

สามารถเลือกสิ่งที่ต้องการจะปรับ แล้วไปที่ Ribbon Format แล้วใส่สี Fill หรือ สีขอบได้ตามต้องการ

โดยที่การเลือกนั้น มีเทคนิคเล็กน้อย คือ

  • ถ้าคลิ๊กซ้ายที่ Data Series ทีเดียว มันจะเลือก Data Series นั้นในทุกๆ Category เลย
  • ถ้าคลิ๊กซ้ายซ้ำอีกรอบเฉพาะบาง Category มันจะเลือกเจาะจงเฉพาะ Category นั้นๆ ได้เลย
  • หรือ อาจเลือกจาก Ribbon Layout => Current Selection ก็ได้ครับ

chart10

การปรับ Scale ของแกน X หรือ Y

  • ให้เลือกที่แกนที่ต้องการจะแก้ จากนั้นคลิ๊กขวา => Format Axis
  • ใน Axis Option สามารถตั้งค่าสูงสุด ต่ำสุด ค่า Major Unit (Grid ใหญ่) Minor Unit (Grid เล็ก)ได้
    • ถ้าจะปรับค่า ต้องเปลี่ยนจาก Auto เป็น Fixed ซะก่อน
  • และยังมี Option อื่นๆ อีกเยอะแยะ ลองเล่นดูนะครับ เช่น กลับทิศของแกน การตั้งจุดตัดแกน แถมตั้งหน่วยได้ด้วยว่าต้องการเป็นหลักหน่วย หลักพัน หลักล้าน หรืออะไร

เทคนิคการปรับ Format Selection

สามารถคลิ๊ก Format Selection อันนึงค้างไว้ แล้วไปคลิ๊กที่ Component อื่นๆ ของกราฟได้เลย ตัว Format Selection จะเปลี่ยนไปเองโดยอัตโนมัติ (โดยไม่ต้องออกไป Select ใหม่ทุกครั้ง)

chart11

การเปลี่ยนประเภทกราฟ

มีอยู่ 2 แบบ

  1. เปลี่ยนกราฟจากประเภทหนึ่งเป็นอีกประเภทหนึ่งกับทุกๆ Series (เปลี่ยนทั้งอัน)
    • ในกรณีนี้สามารถทำได้ง่ายๆ คือ คลิ๊กที่กราฟ แล้วไปที่ Ribbon Design => Change Chart Type
    • จากนั้นเลือกกราฟประเภทใหม่ที่ต้องการได้เลย
      chart7
  2. เปลี่ยนกราฟแค่ข้อมูลบางส่วน (บาง Series ) ทำให้เกิดกราฟลูกผสม
    • ในกรณีนี้มีขั้นตอนเพิ่มจากปกติ คือ ให้เลือก Series ที่ต้องการเปลี่ยนประเภท => คลิ๊กขวาเลือก Change Series Chart Type
    • จากนั้นเลือกกราฟประเภทใหม่ที่ต้องการได้เลย
    • จากนั้นจะเกิดกราฟลูกผสม คือ Series ที่เราไม่ได้เลือก จะยังเป็นประเภทเดิม ส่วน Series ที่เราเลือกเปลี่ยน Chart Type ไป ก็จะกลายเป็นประเภทใหม่
      chart8-2

Line Chart vs Scatter Plot

  • Line Chart กับ Scatter Plot ดูคล้ายกัน แต่ต่างกันที่ Line Chart ทุก Series จะมองแกน X ร่วมกัน และมองเป็นแค่ Text Label
  •  ส่วน Scatter Plot จะใช้ค่าแกน X มา Plot ลงแกนตาม Scale จริงๆ

การปรับแก้การเลือกใช้ Data Source

เราสามารถปรับแก้การเลือกใช้ Data Source โดยการคลิ๊ก Ribbon Design => Select Data

จากนั้นมันจะขึ้นหน้าต่างออกมาดังนี้
select-data

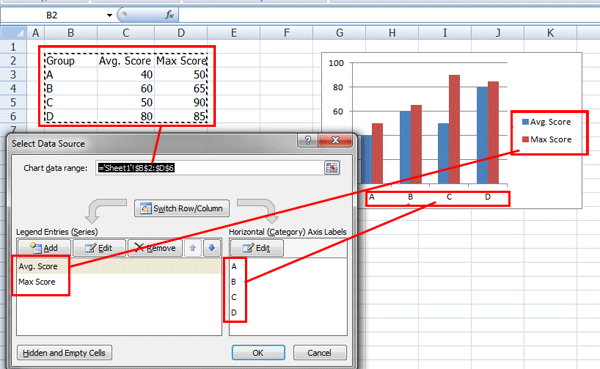
  • ฝั่งซ้ายจะเป็น Data Series ที่เป็นแกน Y ฝั่งขวาเป็นแกน X
  • การเพิ่ม Data Series ใหม่ให้กด Add / จะลบ Data Series ไหนก็กด Remove
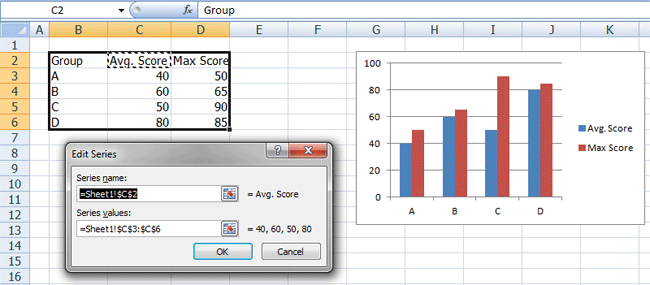
  • การแก้ไขว่าแต่ละ Data Series จะชื่ออะไร มีแกน X หรือ แกน Y คืออะไร ให้เลือก Data Series ที่ต้องการแล้วกด Edit
    • ตรงนี้จะขึ้นกับประเภทกราฟ
    • ถ้าเป็นกราฟ Scatter Plot จะกด Edit ฝั่งซ้ายได้อย่างเดียว แต่พอกดแล้วมันจะให้ใส่ทั้ง Series Name / Series X Value / และ  Series Y Value (นั่นคือ แต่ละ Series จะมีค่า X และ Y ของตัวมันเอง แปลว่า สามารถใช้ค่าแกน X คนละค่ากันได้)
      selectdata-scatter
    • ถ้าเป็นกราฟอื่นๆ เช่น Bar Chart / Column Chart / Line Chart ถ้ากด Edit ฝั่งซ้าย จะมีให้เลือกแค่ Series Name กับ Series Value ส่วน Horizontal Axis จะบังคับให้ใช้ค่าเดียวกันกับทุกๆ Series (สามารถกด Edit ได้อยู่ แต่กดแล้วจะ Apply กับทุกๆ Series เลย)
      selectdata-normal
  • จะสลับ Sequence ลำดับก่อนหลัง (มีผลเรื่องการบังกัน อยู่ด้านหน้า-หลัง) ให้กดลูกศรสีฟ้าขึ้นลง

การเพิ่มแกนอันที่ 2 (Secondary Axis)

มี 2 แบบด้วยกัน คือ เพิ่มแกน Y อันที่2 กับ เพิ่มแกน X อันที่ 2

ผมขอเริ่มที่เพิ่มแกน Y อันที่ 2 ก่อนนะครับ

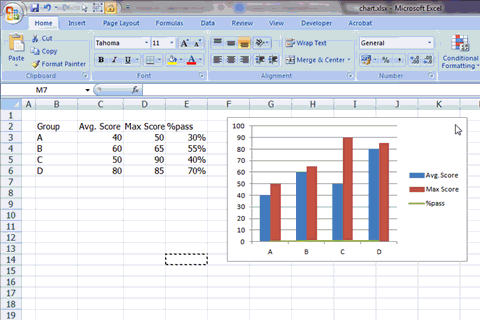
สมมติข้อมูลของผมใรคอลัมน์เพิ่มมา 1 อัน คือ %pass แล้วมันมีค่าน้อยมากๆ (เพราะเป็น %) ทำให้เวลา Plot รวมกับ Avg.Score หรือ Max Score บนแกน Y เดียวกันจะแทบมองไม่เห็นเลย ทางแก้ไขก็คือ ผมต้องเอาค่า %pass นี้ไป Plot ลงใน Secondary Y-Axis นั่นเอง

สมมติว่าผม add คอลัมน์ใหม่ คือ % pass ลงไปในกราฟแล้วนะครับ ต่อไปทำดังนี้

  • เลือก Series %pass แล้ว Format Data Seriesโดย
    • อาจเลือกจาก Ribbon Layout => Current Selection ก็ได้ครับ => จากนั้นเลือก Format Selection
    • หรือจะคลิ๊กขวาที่ Series %pass โดยตรงแล้วเลือก Format Data Series
  • จากนั้นใน Series Option => เลือก Plot on Secondary Axis
    chart9

การเพิ่มแกน X อันที่สอง

ที่นี้ หากต้องการจะเพิ่มแกน X อันที่สอง ต้องทำหลังจากเพิ่มแกน Y อันที่ 2 ไปก่อนครับ ถึงจะมี Option โผล่มาให้เลือก

จากนั้น ให้ไปที่ Ribbon Layout => Axes => Secondary Horizontal Axis => เลือกแบบที่ต้องการ

สำหรับตอนนี้ขอจบแค่นี้ ตอนต่อๆ ไปเราจะมาเรียนรู้การทำกราฟแบบ Advance ขึ้นไปอีกครับ! มีอะไรสงสัย อย่าลืมไปคุยกันใน Facebook Page นะครับ

แชร์ความรู้ให้เพื่อนๆ ของคุณ
17    
17    

ติดตามเทพเอ็กเซล

  • Facebook
  • YouTube

อบรมกับเทพเอ็กเซล

คอร์สออนไลน์ เทพเอ็กเซล
คอร์สออนไลน์ จากเทพเอ็กเซล ดูกี่รอบก็ได้
อบรม Excel / Power BI ให้องค์กรของคุณ

บทความล่าสุด

  • การทำ Simulation ด้วย Excel
  • แกะเคล็ดวิชา Excel Wizard ในการแข่ง Speed Run Excel ระดับโลก
  • เจาะลึก CALCULATE ใน DAX แบบลึกสุดใจ : Part 2
  • วิธีใช้ Power Query ดึงข้อมูล EMS Tracking จากไปรษณีย์ไทย ผ่าน Web API
  • เจาะลึก CALCULATE ใน DAX แบบลึกสุดใจ : Part 1
  • Series สอนดึงข้อมูลจากเว็บ ด้วย Power Automate Desktop
  • ทำความเข้าใจวิธีสั่ง MidJourney แบบละเอียด เพื่อให้ได้ผลลัพธ์ตรงใจ (มากขึ้น)

บทความแนะนำ

🔥ฟังก์ชันทั้งหมดใน Excel 🔥

  • แกะเคล็ดวิชา Excel Wizard ในการแข่ง Speed Run Excel ระดับโลก
  • เจาะลึก CALCULATE ใน DAX แบบลึกสุดใจ : Part 1
  • Series สอนดึงข้อมูลจากเว็บ ด้วย Power Automate Desktop
  • สรุปการใช้ LAMBDA ฟังก์ชันที่ใช้สร้างฟังก์ชันใน Excel 365 และผองเพื่อน
  • วิธีใช้ Excel คำนวณระยะเวลาการทำงานรวม แถมระบุเวลาพักได้แบบยืดหยุ่น
  • วิธีจัดการข้อมูลแย่ๆ ด้วย Power Query ทั้งข้อมูลปนกัน ข้อมูลอยู่บนหัวตาราง
  • แยกข้อมูลที่อยู่สุดเน่า ด้วย Excel Power Query

Categories

Tags

collection concepts copy database Data Model data table data validation date dax dropdown error excel filter finance find format formula function game graph IF index intro iterative len link logic lookup match m code merge mid overview paste pivot power query project row sort speed split substitute table text textjoin time tips trim vba vlookup

Archives

  • January 2023 (1)
  • October 2022 (1)
  • September 2022 (3)
  • August 2022 (3)
  • July 2022 (1)
  • June 2022 (3)
  • May 2022 (1)
  • April 2022 (2)
  • February 2022 (1)
  • December 2021 (2)
  • November 2021 (10)
  • September 2021 (2)
  • August 2021 (6)
  • July 2021 (2)
  • June 2021 (2)
  • May 2021 (10)
  • April 2021 (3)
  • March 2021 (3)
  • February 2021 (4)
  • January 2021 (8)
  • December 2020 (5)
  • November 2020 (13)
  • October 2020 (5)
  • September 2020 (11)
  • August 2020 (4)
  • July 2020 (13)
  • June 2020 (17)
  • May 2020 (16)
  • April 2020 (16)
  • March 2020 (10)
  • February 2020 (15)
  • January 2020 (16)
  • December 2019 (4)
  • November 2019 (3)
  • October 2019 (9)
  • September 2019 (1)
  • August 2019 (7)
  • June 2019 (3)
  • May 2019 (9)
  • April 2019 (9)
  • March 2019 (2)
  • February 2018 (1)
  • January 2018 (3)
  • November 2017 (3)
  • August 2017 (1)
  • July 2017 (1)
  • June 2017 (1)
  • May 2017 (6)
  • April 2017 (6)
  • March 2017 (7)
  • February 2017 (1)
  • January 2017 (2)
  • December 2016 (1)
  • October 2016 (2)
  • September 2016 (3)
  • August 2016 (2)
  • July 2016 (2)
  • June 2016 (1)
  • May 2016 (1)
  • April 2016 (1)
  • March 2016 (2)
  • February 2016 (1)
  • January 2016 (2)
  • December 2015 (2)
  • November 2015 (5)
  • October 2015 (3)
  • June 2015 (2)
  • May 2015 (1)
  • April 2015 (26)
  • January 2015 (1)
  • December 2014 (1)
  • November 2014 (2)
  • October 2014 (1)
  • September 2014 (2)
  • August 2014 (1)
  • June 2014 (1)
  • May 2014 (1)
  • April 2014 (3)
  • March 2014 (3)
  • February 2014 (12)
  • January 2014 (7)
  • December 2013 (2)
  • November 2013 (8)
  • October 2013 (2)

เทพเอ็กเซล : Thep Excel

copyright © 2022

  • Facebook
  • YouTube
เว็บไซต์นี้ใช้คุกกี้ (Cookies)
บริษัท เทพเอ็กเซล จำกัด ให้ความสำคัญต่อข้อมูลส่วนบุคคลของท่าน เพื่อการพัฒนาและปรับปรุงเว็บไซต์รวมถึงสินค้าและบริการต่างๆ หากท่านใช้บริการเว็บไซต์นี้ โดยไม่มีการปรับตั้งค่าใดๆ แสดงว่าท่านยินยอมที่จะรับคุกกี้บนเว็บไซต์ และนโยบายสิทธิส่วนบุคคลของเรา
ตั้งค่าคุกกี้ยอมรับทั้งหมดอ่านเพิ่มเติม
Manage consent

Privacy Overview

This website uses cookies to improve your experience while you navigate through the website. Out of these, the cookies that are categorized as necessary are stored on your browser as they are essential for the working of basic functionalities of the website. We also use third-party cookies that help us analyze and understand how you use this website. These cookies will be stored in your browser only with your consent. You also have the option to opt-out of these cookies. But opting out of some of these cookies may affect your browsing experience.
Necessary
Always Enabled
Necessary cookies are absolutely essential for the website to function properly. These cookies ensure basic functionalities and security features of the website, anonymously.
CookieDurationDescription
cookielawinfo-checkbox-analytics11 monthsThis cookie is set by GDPR Cookie Consent plugin. The cookie is used to store the user consent for the cookies in the category "Analytics".
cookielawinfo-checkbox-functional11 monthsThe cookie is set by GDPR cookie consent to record the user consent for the cookies in the category "Functional".
cookielawinfo-checkbox-necessary11 monthsThis cookie is set by GDPR Cookie Consent plugin. The cookies is used to store the user consent for the cookies in the category "Necessary".
cookielawinfo-checkbox-others11 monthsThis cookie is set by GDPR Cookie Consent plugin. The cookie is used to store the user consent for the cookies in the category "Other.
cookielawinfo-checkbox-performance11 monthsThis cookie is set by GDPR Cookie Consent plugin. The cookie is used to store the user consent for the cookies in the category "Performance".
viewed_cookie_policy11 monthsThe cookie is set by the GDPR Cookie Consent plugin and is used to store whether or not user has consented to the use of cookies. It does not store any personal data.
Functional
Functional cookies help to perform certain functionalities like sharing the content of the website on social media platforms, collect feedbacks, and other third-party features.
Performance
Performance cookies are used to understand and analyze the key performance indexes of the website which helps in delivering a better user experience for the visitors.
Analytics
Analytical cookies are used to understand how visitors interact with the website. These cookies help provide information on metrics the number of visitors, bounce rate, traffic source, etc.
Advertisement
Advertisement cookies are used to provide visitors with relevant ads and marketing campaigns. These cookies track visitors across websites and collect information to provide customized ads.
Others
Other uncategorized cookies are those that are being analyzed and have not been classified into a category as yet.
SAVE & ACCEPT