ThepExcel Logo
  • บทความ
    • Excel
      • Excel ทั่วไป
      • Excel Pivot Table
      • Excel Power Pivot
      • Power Query
      • Excel Array Formula
      • Excel VBA
      • Excel for Business
      • Excel and Maths
      • ฟังก์ชัน Excel ทั้งหมด
    • Power BI
      • Power Query
      • Data Model
      • DAX Formula
      • Power BI Report
    • Coding
      • Excel VBA
      • Python
      • Power Query M Code
    • Highlights : บทความแนะนำ
    • คลิปวีดีโอ
  • อบรม
    • อบรมลูกค้าองค์กร
    • คอร์สออนไลน์ SkillLane
    • แนะนำวิทยากร
    • Excel/Power BI Skill Map
    • Quiz
  • Shop
    • คอร์สออนไลน์
    • สินค้าทั้งหมด
    • หนังสือเล่ม
    • E-Book
    • Cart
  • Download
    • Download ไฟล์จากเทพเอ็กเซล
    • ThepExcel-Mfx : M Code สำเร็จรูป
    • Date Table สำเร็จรูป
    • กราฟ My Skill
    • github.com/ThepExcel
  • รวม Link
    • รวม Link สอน Excel & Power BI ทั้งไทยและเทศ
    • รวม Link สอน Python / Programming
    • หนังสือแนะนำ
    • Facebook ThepExcel
    • YouTube ThepExcel
    • DAX Formatter
  • Contact
    • แนะนำ เทพเอ็กเซล (Thep Excel)
    • แนะนำวิทยากร : อาจารย์ ศิระ เอกบุตร (ระ)
    • นโยบายการคุ้มครองข้อมูลส่วนบุคคล (Privacy Policy)
  • Facebook
  • YouTube

วิธีทลายข้อจำกัดหน้าตาของ PivotTable ด้วย OLAP CUBE Formula

Categories 📂

Excel Pivot Table

Tags 🏷️

cube, Data Model, format, insert, olap, pivot

จากที่ผมได้ Post ถามหยั่งเชิงใน Facebook ไปว่าใครสนใจวิธีทำลายข้อจำกัดเรื่องหน้าตาของ PivotTable บ้าง? ปราฏว่ามีคนให้ความสนใจเยอะมากๆ ดังนั้นผมเลยขอมาเขียนบทความอธิบายให้เล็กน้อยครับ

สารบัญ

  • PivotTable นั้นสร้างง่ายมาก แต่จัด Layout ไม่ได้ดั่งใจ
  • วิธีจัด Layout ที่อาจพอรู้กันอยู่แล้ว
  • วิธี OLAP CUBE Formula
    • ใช้ Data Model (Excel 2013 ขึ้นไป)
    • ใช้ PowerPivot (Excel 2010 ขึ้นไป)
  • ผลลัพธ์ยังสามารถผูกกับ Slicer ได้เช่นเดิม
  • CUBE เป็นสูตร แต่ยังต้องกด Refresh เช่นเดียวกับ Pivot
    • Refresh ที่ Data Connections
    • Refresh ที่ PivotTables
  • จบแล้ว

PivotTable นั้นสร้างง่ายมาก แต่จัด Layout ไม่ได้ดั่งใจ

ข้อดีสุดๆ ของ PivotTable นั้นคือ ใช้งานง่ายมาก เรียนรู้แป๊ปเดียวก็เป็นแล้ว และใช้เวลาสร้างแป๊ปเดียวก็ได้ตารางสรุปข้อมูลที่พร้อมจะนำคำตอบที่ได้ไปเสนอผู้บริหารแล้ว

แต่สิ่งที่มักจะเกิดขึ้นตามมาคือ คำพูดของหัวหน้าที่บอกว่า “รายงานนี้มันหน้าตาไม่สวยเลย ช่วยจัด xxx เว้นบรรทัด yyy แทรกคอลัมน์ zzz หน่อยสิ”

แล้วคุณก็คงตอบกลับไปแบบสุภาพว่า “อ๋อ ทำไม่ได้ครับ…มันเป็นข้อจำกัดของ PivotTable ครับหัวหน้า” ทั้งๆ ที่จริงๆ อาจอยากตะโกนตอบกลับไปว่า “PivotTable มันแทรกบรรทัดไม่ได้เฟ้ย!”

วิธีจัด Layout ที่อาจพอรู้กันอยู่แล้ว

แต่ถ้าคุณอยากจะทำให้รายงานมันสวยได้ดั่งใจจริงๆ ก็มีวิธีที่หลายคนอาจจะรู้อยู่แล้ว ดังนี้

  1. Copy Pivot แล้ว Paste Value เพื่อเอาไปทำรายงาน : วิธีนี้ไม่แนะนำเป็นอย่างยิ่ง เพราะเสียความสามารถในการ Refresh ข้อมูลไปเลย ควรทำเฉพาะกรณีที่คิดว่าทำครั้งเดียวในชีวิต ไม่ต้องทำอีกแล้ว 555
  2. ใช้ GETPIVOTDATA : ปกติเวลากด = แล้วคลิ๊กไปในพื้นที่ Pivot แต่ละ Cell มันจะดึงข้อมูล Cell นั้นมา โดยสร้างสูตรยาวๆ ที่ขึ้นต้นด้วยคำว่า GETPIVOTDATA มาให้ด้วย
    • ซึ่งข้อดีคือ ไม่ว่า Pivot Table ต้นทางจะย้ายไปไหน หรือมีการ Filter Row/Column Label บางอย่างจนข้อมูลเลื่อนไปที่อื่น เจ้า GETPIVOTDATA จะยังเอาข้อมูลที่ถูกต้องมาให้
    • ข้อเสียคือ จะต้องกด = จิ้มทีละ Cell หรือเขียนสูตรทีละ Cell ซึ่งลำบากมากกว่าจะได้ครับ
  3. กด = แล้วจิ้ม แบบ Cell Reference ปกติ : บางคนไม่ชอบ GETPIVOTDATA เลยไปเลือก Option ให้ Excel ไม่ต้องสร้างเจ้าฟังก์ชันนั้นขึ้นมาให้ (ติ๊ก Generate GetPivotData ออก) โดยอยากให้จิ้มแล้วเป็น Cell Reference ธรรมดาแทน จะได้เขียน/copy สูตรง่ายๆ
     
    • ข้อดี : เขียนง่ายมาก แค่ = แล้วจิ้ม จากนั้น Copy มาได้ตามปกติ
    • ข้อเสีย : เสี่ยงต่อการที่ PivotTable เลื่อนจากที่เดิม ทำให้ได้ข้อมูลที่ผิดกลับไปโดยไม่รู้ตัว
  4. เลิกใช้ Pivot หันมาเขียนสูตรแทน : วิธีนี้เรียกว่าเปลี่ยนแนวโดยสิ้นเชิง เขียนสูตรเอาเองดีกว่า ไม่ง้อ Pivot ก็ได้ ไม่ว่าจะเป็นสูตรง่ายๆ อย่าง SUMIFS หรือจะใช้ Data Table มาช่วย หรืออาจจะใช้ Array Formula กรณีที่การคำนวณซับซ้อน
    • ข้อดี : มีความยืดหยุ่นสูงกว่า Pivot
    • ข้อเสีย : เขียนสูตรยาก (บางคนเจอตรงนี้ก็ยอมแพ้แล้ว) และอาจคำนวณช้ากว่า Pivot

แต่วันนี้ผมมีอีกวิธีมาแนะนำครับ นั่นคือ ใช้ความสามารถที่เรียกว่า OLAP CUBE Formula

วิธี OLAP CUBE Formula

วิธีนี้ดีตรงที่ ไม่ต้องเขียนสูตรเอง และยังสามารถอัปเดทผลลัพธ์ได้เมื่อข้อมูลต้นทางเปลี่ยน เช่นเดียวกับ PivotTable เลย แต่ผมจะไม่ขอพูดทฤษฏี ณ ตอนนี้แล้วกันเอาเป็นว่าบทความนี้มาลองทำกันเลยนะครับ

ผมจะขอแบ่งออกเป็น 2 วิธี คือ 1. ใช้ Data Model (Excel 2013 ขึ้นไป) 2. ใช้ PowerPivot (ซึ่งใช้ได้ตั้งแต่ Excel 2010 แต่ต้องลง Add-in) ซึ่งวิธีแรกน่าจะง่ายกว่าสำหรับคนส่วนใหญ่ครับ

ใช้ Data Model (Excel 2013 ขึ้นไป)

มี Step ประมาณนี้

  1. ตอนจะสร้าง PivotTable ให้ติ๊กช่อง Add to Data Model ด้วย
  2. สร้าง Pivot ให้สรุปข้อมูลตามปกติ เอาให้คล้ายรายงานที่ต้องการมากที่สุดก่อน
  3. ไปคลิ๊ก OLAP Tools -> Convert to Formulas…
     
    • เพียงเท่านี้ PivotTable ก็จะถูกแปลงเป็น Cell ที่เต็มไปด้วยสูตร CUBE ซึ่งข้อมูลแต่ละช่องจะแยกออกจากกัน
  4. จัด Layout ตามใจชอบ – คุณจะแทรกคอลัมน์ยังไง โยกข้อมูลยังไง ก็สามารถทำได้แล้ว

จะเห็นว่า ผมจะปรับแต้งหน้าตายังไงก็ได้เลย ซึ่งอิสระขึ้นมากๆ ครับ ^^

ใช้ PowerPivot (Excel 2010 ขึ้นไป)

มี Step ประมาณนี้

  1. ถ้ายังไม่มี PowerPivot ให้ไปโหลดมา install ก่อน => Download ที่นี่
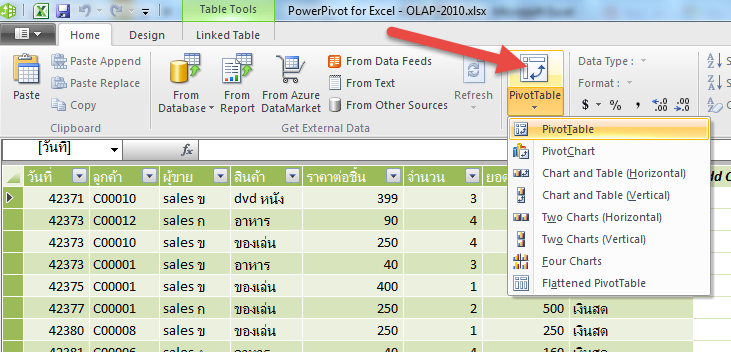
  2. Add Data เข้า Power Pivot โดยกดปุ่ม Create Linked Table
  3. สร้าง Pivot จากหน้าต่าง PowerPivot
  4. จากนั้นก็เหมือนแบบวิธี Data Model แล้วล่ะ จัดระเบียบแล้วกด Convert to Formulas โลด!
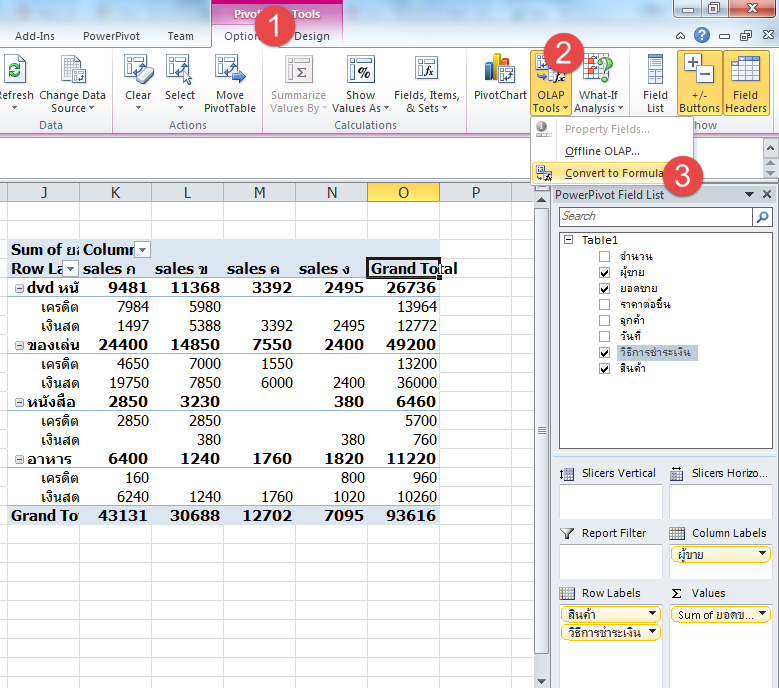
  5. Pivot จะถุกกระจายกลายเป็นสูตรที่แยกกันคนละช่องเช่นเดียวกับวิธีข้างบนครับ

ผลลัพธ์ยังสามารถผูกกับ Slicer ได้เช่นเดิม

หากตอนแรก Pivot ของเรามีการผูก Slicer ไว้ หลังจากแปลงเป็น CUBE Formula แล้ว Slicer ก็ยังทำงานได้นะครับ

หลังกด Slicer ผลลัพธ์ก็จะถูกตัดกรองเช่นเดียวกับ PivotTable ปกติเลย!!

แปลว่า เราสามารถเอาวิธีการนี้ ไปสร้าง Dashboard เท่ๆ ได้เลยนะ!!

CUBE เป็นสูตร แต่ยังต้องกด Refresh เช่นเดียวกับ Pivot

เนื่องจากสูตรแบบ CUBE เป็นการเชื่อมต่อกับฐานข้อมูล ดังนั้นเวลาทำงานจริง หากข้อมูลต้นทางเปลี่ยนไป จะต้องมีการกด Refresh ก่อน ผลลัพธ์จึงจะเปลี่ยน เช่นเดียวกับ Pivot Table ซึ่งเรา Refresh ได้ 2 ที่ คือ

Refresh ที่ Data Connections

ซึ่งสามารถ Refresh ได้ที่เครื่องมือ Data -> Refresh All ครับ

อย่าลืม!! ถ้าเราไม่ Refresh ผลลัพธ์จะไม่เปลี่ยนนะ

Refresh ที่ PivotTables

แต่ถ้าใครไม่ชอบวิธีนี้ จะกด Refresh ที่ PivotTables ก็ได้นะ แต่ต้องทำการเก็บ Pivot ไว้อย่างน้อยอันนึงก่อนที่จะแปลงเป็น OLAP Formula นะครับ (ถ้าแปลงไปแล้ว จะกดที่กด Refresh แบบ Pivot ไม่เจอ)

คราวนี้เราจะ Refresh ที่ Pivot ได้ตามปกติแล้ว

จบแล้ว

หวังว่าบทความนี้จะมีประโยชน์ในการทำรายงานของเพื่อนๆ นะครับ ใครเห็นว่าเป็นประโยชน์ก็ช่วยบอกต่อหน่อยนะครับ ^^ ส่วนใครลองทำตามนี้แล้วติดปัญหาอะไรก็สอบถามมาได้ครับ

แชร์ความรู้ให้เพื่อนๆ ของคุณ
5    
5    

ติดตามเทพเอ็กเซล

  • Facebook
  • YouTube

อบรมกับเทพเอ็กเซล

คอร์สออนไลน์ เทพเอ็กเซล
คอร์สออนไลน์ จากเทพเอ็กเซล ดูกี่รอบก็ได้
อบรม Excel / Power BI ให้องค์กรของคุณ

บทความล่าสุด

  • การทำ Simulation ด้วย Excel
  • แกะเคล็ดวิชา Excel Wizard ในการแข่ง Speed Run Excel ระดับโลก
  • เจาะลึก CALCULATE ใน DAX แบบลึกสุดใจ : Part 2
  • วิธีใช้ Power Query ดึงข้อมูล EMS Tracking จากไปรษณีย์ไทย ผ่าน Web API
  • เจาะลึก CALCULATE ใน DAX แบบลึกสุดใจ : Part 1
  • Series สอนดึงข้อมูลจากเว็บ ด้วย Power Automate Desktop
  • ทำความเข้าใจวิธีสั่ง MidJourney แบบละเอียด เพื่อให้ได้ผลลัพธ์ตรงใจ (มากขึ้น)

บทความแนะนำ

🔥ฟังก์ชันทั้งหมดใน Excel 🔥

  • แกะเคล็ดวิชา Excel Wizard ในการแข่ง Speed Run Excel ระดับโลก
  • เจาะลึก CALCULATE ใน DAX แบบลึกสุดใจ : Part 1
  • Series สอนดึงข้อมูลจากเว็บ ด้วย Power Automate Desktop
  • สรุปการใช้ LAMBDA ฟังก์ชันที่ใช้สร้างฟังก์ชันใน Excel 365 และผองเพื่อน
  • วิธีใช้ Excel คำนวณระยะเวลาการทำงานรวม แถมระบุเวลาพักได้แบบยืดหยุ่น
  • วิธีจัดการข้อมูลแย่ๆ ด้วย Power Query ทั้งข้อมูลปนกัน ข้อมูลอยู่บนหัวตาราง
  • แยกข้อมูลที่อยู่สุดเน่า ด้วย Excel Power Query

Categories

Tags

collection concepts copy database Data Model data table data validation date dax dropdown error excel filter finance find format formula function game graph IF index intro iterative len link logic lookup match m code merge mid overview paste pivot power query project row sort speed split substitute table text textjoin time tips trim vba vlookup

Archives

  • January 2023 (1)
  • October 2022 (1)
  • September 2022 (3)
  • August 2022 (3)
  • July 2022 (1)
  • June 2022 (3)
  • May 2022 (1)
  • April 2022 (2)
  • February 2022 (1)
  • December 2021 (2)
  • November 2021 (10)
  • September 2021 (2)
  • August 2021 (6)
  • July 2021 (2)
  • June 2021 (2)
  • May 2021 (10)
  • April 2021 (3)
  • March 2021 (3)
  • February 2021 (4)
  • January 2021 (8)
  • December 2020 (5)
  • November 2020 (13)
  • October 2020 (5)
  • September 2020 (11)
  • August 2020 (4)
  • July 2020 (13)
  • June 2020 (17)
  • May 2020 (16)
  • April 2020 (16)
  • March 2020 (10)
  • February 2020 (15)
  • January 2020 (16)
  • December 2019 (4)
  • November 2019 (3)
  • October 2019 (9)
  • September 2019 (1)
  • August 2019 (7)
  • June 2019 (3)
  • May 2019 (9)
  • April 2019 (9)
  • March 2019 (2)
  • February 2018 (1)
  • January 2018 (3)
  • November 2017 (3)
  • August 2017 (1)
  • July 2017 (1)
  • June 2017 (1)
  • May 2017 (6)
  • April 2017 (6)
  • March 2017 (7)
  • February 2017 (1)
  • January 2017 (2)
  • December 2016 (1)
  • October 2016 (2)
  • September 2016 (3)
  • August 2016 (2)
  • July 2016 (2)
  • June 2016 (1)
  • May 2016 (1)
  • April 2016 (1)
  • March 2016 (2)
  • February 2016 (1)
  • January 2016 (2)
  • December 2015 (2)
  • November 2015 (5)
  • October 2015 (3)
  • June 2015 (2)
  • May 2015 (1)
  • April 2015 (26)
  • January 2015 (1)
  • December 2014 (1)
  • November 2014 (2)
  • October 2014 (1)
  • September 2014 (2)
  • August 2014 (1)
  • June 2014 (1)
  • May 2014 (1)
  • April 2014 (3)
  • March 2014 (3)
  • February 2014 (12)
  • January 2014 (7)
  • December 2013 (2)
  • November 2013 (8)
  • October 2013 (2)

เทพเอ็กเซล : Thep Excel

copyright © 2022

  • Facebook
  • YouTube
เว็บไซต์นี้ใช้คุกกี้ (Cookies)
บริษัท เทพเอ็กเซล จำกัด ให้ความสำคัญต่อข้อมูลส่วนบุคคลของท่าน เพื่อการพัฒนาและปรับปรุงเว็บไซต์รวมถึงสินค้าและบริการต่างๆ หากท่านใช้บริการเว็บไซต์นี้ โดยไม่มีการปรับตั้งค่าใดๆ แสดงว่าท่านยินยอมที่จะรับคุกกี้บนเว็บไซต์ และนโยบายสิทธิส่วนบุคคลของเรา
ตั้งค่าคุกกี้ยอมรับทั้งหมดอ่านเพิ่มเติม
Manage consent

Privacy Overview

This website uses cookies to improve your experience while you navigate through the website. Out of these, the cookies that are categorized as necessary are stored on your browser as they are essential for the working of basic functionalities of the website. We also use third-party cookies that help us analyze and understand how you use this website. These cookies will be stored in your browser only with your consent. You also have the option to opt-out of these cookies. But opting out of some of these cookies may affect your browsing experience.
Necessary
Always Enabled
Necessary cookies are absolutely essential for the website to function properly. These cookies ensure basic functionalities and security features of the website, anonymously.
CookieDurationDescription
cookielawinfo-checkbox-analytics11 monthsThis cookie is set by GDPR Cookie Consent plugin. The cookie is used to store the user consent for the cookies in the category "Analytics".
cookielawinfo-checkbox-functional11 monthsThe cookie is set by GDPR cookie consent to record the user consent for the cookies in the category "Functional".
cookielawinfo-checkbox-necessary11 monthsThis cookie is set by GDPR Cookie Consent plugin. The cookies is used to store the user consent for the cookies in the category "Necessary".
cookielawinfo-checkbox-others11 monthsThis cookie is set by GDPR Cookie Consent plugin. The cookie is used to store the user consent for the cookies in the category "Other.
cookielawinfo-checkbox-performance11 monthsThis cookie is set by GDPR Cookie Consent plugin. The cookie is used to store the user consent for the cookies in the category "Performance".
viewed_cookie_policy11 monthsThe cookie is set by the GDPR Cookie Consent plugin and is used to store whether or not user has consented to the use of cookies. It does not store any personal data.
Functional
Functional cookies help to perform certain functionalities like sharing the content of the website on social media platforms, collect feedbacks, and other third-party features.
Performance
Performance cookies are used to understand and analyze the key performance indexes of the website which helps in delivering a better user experience for the visitors.
Analytics
Analytical cookies are used to understand how visitors interact with the website. These cookies help provide information on metrics the number of visitors, bounce rate, traffic source, etc.
Advertisement
Advertisement cookies are used to provide visitors with relevant ads and marketing campaigns. These cookies track visitors across websites and collect information to provide customized ads.
Others
Other uncategorized cookies are those that are being analyzed and have not been classified into a category as yet.
SAVE & ACCEPT