


ถ้าใครได้หัดใช้ DAX ไม่ว่าจะใน Power BI หรือ Data Model ของ Excel มาซักพักจะรู้ว่า ฟังก์ชันที่ทรงพลังที่สุดใน DAX ก็คือ CALCULATE (และพี่น้องของมันอย่าง CALCULATETABLE ) อย่างไม่ต้องสงสัย
ในบทความนี้ผมจะมาทำความเข้าใจพฤติกรรมของ CALCULATE แบบเจาะลึกกันแบบละเอียดยิบๆๆๆๆ โดยทำการทดสอบหลายๆ อย่างพร้อมบันทึกภาพประกอบไว้ด้วย เพื่อให้ทุกท่านได้ร่วมพิสูจน์หาความจริงไปด้วยกัน
ป.ล. ตอนแรกจะทำตอนเดียวจบ แต่เขียนไปแล้วยาวมากๆ ยังไม่จบเลย ขอเอามาให้ดู 1 Part ก่อนแล้วกันครับ 555
ไฟล์ประกอบบทความ
https://github.com/ThepExcel/download/blob/master/DAX-Advance-start.pbix
เพื่อนๆ สามารถลองโหลดไฟล์นี้มาทำตามไปด้วยกันได้เลยครับ
ก่อนอื่นเรามาดูหน้าตา Data Model กันก่อน

- ตาราง Fact คือตารางชื่อ OrderDetail และตาราง target นอกนั้นเป็นตาราง Dimension ทั้งหมด
- ตาราง Dimension ที่ Filter ทั้ง OrderDetail และ target ได้ ก็คือตาราง dDate และ ProductCategory เท่านั้น
- ส่วนตาราง dDate ผูกกับ OrderDetail ผ่าน Relationship 2 เส้น คือ
- เส้น Active : Date -> Order Date
- เส้น Inactive : Date -> Delivery Date
Measure พื้นฐานที่จะใช้
ใช้แค่ SUM กับ DISTINCTCOUNT ง่ายๆ แบบนี้เลยครับ
หายอดจำนวนชิ้นรวม
Total Qty = SUM(OrderDetail[Quantity])หายอดขายรวม
Total Revenue = SUM(OrderDetail[Revenue])หาจำนวนลูกค้าที่ซื้อของ
Total Customer = DISTINCTCOUNT(OrderDetail[CustomerKey])ทำความเข้าใจ Filter Context
CALCULATE และ CALCULATETABLE เป็นฟังก์ชัน DAX ที่มีความสามารถพิเศษคือ การเปลี่ยนแปลง Filter Context ได้ก่อนที่จำทำการคำนวณผลลัพธ์ออกมา ซึ่ง CALCULATE จะได้ผลลัพธ์เป็น Scalar (ค่าเดียว) แต่ CALCULATETABLE จะให้ผลลัพธ์เป็น Table (เป็นตาราง แต่จะมีกี่คอลัมน์กี่แถวก็ได้)
อะไรคือเปลี่ยนแปลง Filter Context ก่อนคำนวณผล? จะเข้าใจได้ เราก็ต้องรู้ก่อนว่า Filter Context คืออะไร

หากพิจารณาผลลัพธ์จาก Matrix ตัวนี้ที่ใช้ Measure Total Qty ในช่อง Value
ตัวเลขแต่ละตำแหน่งของตาราง Matrix ให้ผลลัพธ์ที่ไม่เหมือนกันได้ แม้จะใช้ Measure เดียวกัน เป็นเพราะมี Filter Context ที่ต่างกัน
ตัวเลขที่ผมกำลังเลือกดูนั้นอยู่ในจุดที่มี Filter Context คือ
- Product[Brand] เป็น Contoso
และ - Customer[Customer Type] เป็น Person
นั่นแปลว่าก่อนที่ Model จะคำนวณค่า Total Qty ออกมาได้ มันจะต้องทำการ Filter Data Model ตามเงื่อนไขของ Filter Context ซะก่อน ทำให้ผลลัพธ์ของ OrderDetail[Quantity] ที่มองเห็นเหลือน้อยลงก่อนจะถูก SUM ออกมาโดย Measure นั่นเอง
ลองใช้ CALCULATE เปลี่ยน Filter Context
สมมติว่าผมไม่แบ่ง Customer Type ใน Matrix แต่ใช้การสร้าง Measure ใหม่ด้วย CALCULATE จะได้ผลแบบนี้
Person Cust Total Qty = CALCULATE([Total Qty],Customer[Customer Type]="Person")
นั่นคือ ผมใช้ CALCULATE เปลี่ยนแปลง Filter Context ก่อนจะคำนวณ Total Qty ออกมา โดยสั่งให้ Customer Type เป็น Person ซะ ดังนั้นในแถวที่ Brand เป็น Contoso จะเห็นว่า
- Total Qty จะได้ 117,157 ซึ่งมีผลมาจาก Filter Context เรื่อง
- Product[Brand] เป็น Contoso อย่างเดียว
- แล้วคำนวณ SUM(OrderDetail[Quantity]) ทีหลัง
- Person Cust Total Qty จะได้ 16,241 เพราะมีผลมาจาก Filter Context เรื่อง
- Product[Brand] เป็น Contoso และ
- Customer[Customer Type] เป็น Person
- แล้วคำนวณ [Total Qty] ทีหลัง
ตรงนี้หลายคนอาจจะคิดว่า CALCULATE เป็นการสั่งให้ Filter เพิ่ม แต่จริงๆ แล้วมันคือการเปลี่ยน Filter ต่างหาก เช่น หากผมสั่งแบบนี้
Contoso Total Qty = CALCULATE([Total Qty],'Product'[Brand]="Contoso")
จะเห็นว่าในบรรทัดที่ Brand ไม่ใช่ Contoso อย่างเช่น Litware ที่ควรมี Filter Context คือ Product[Brand] เป็น Litware ก็ได้ถูกเปลี่ยนให้กลายเป็น Product[Brand] เป็น Contoso ด้วยเช่นกัน
นอกจากที่เราจะเปลี่ยน Filter ได้แล้ว เรายังสามารถปลด Filter ทิ้งได้ด้วย โดยการใช้ REMOVEFILTERS, ALL, ALLSELECTED, ALLEXCEPT
Total Qty All Brand = CALCULATE([Total Qty],
REMOVEFILTERS('Product'[Brand])    //หรือ ALL('Product'[Brand]) ก็ได้
)
เช่น ถ้าเราใช้ REMOVEFILTERS ไปที่ ‘Product'[Brand] ก็จะแปลว่าเราปลด Filter เรื่อง Product Brand ออกซะ ดังนั้น Filter Context เดิมที่มีอยู่เกี่ยวกับ Brand ก็จะถูกทำลายทิ้ง ทำให้เราเราเห็นยอดของ Total Qty รวมของทุก Brand เสมอ (ไม่ว่าเดิมจะเคยมี Filter มาจากไหนก็ตาม)

ทำความเข้าใจ ALL เพิ่มซักนิด
REMOVEFILTERS กับ ALL นั้นถ้าใช้ในฐานะของ Filter ของ CALCULATE จะทำงานเหมือนกันเลย คือ การปลด Filter ทิ้ง แต่ว่า ALL (และผองเพื่อนคนอื่นๆ ) สามารถใช้ในฐานะ Table Function ได้ด้วย นั่นคือจะสร้างตารางออกมาแบบเห็นทุกค่าเหมือนไม่ได้มีการ Filter ใดๆ เช่น
ALL('Product'[Brand])- ถ้าใช้ในฐานะ Filter ของ CALCULATE แบบตรงๆ : จะทำการ ปลด Filter จาก Field Brand ของตาราง Product (ปลด แปลว่าไม่มีระบุค่าใดๆ)
- ถ้าใช้ในฐานะ Table Function : เช่น ใช้ใน FILTER แปลว่าจะเป็น การได้ตารางที่แสดงค่าของคอลัมน์ที่เลือกออกมาแบบเห็นทุกค่าเสมอ เหมือนไม่ได้มีการ Filter ใดๆ (ไม่ว่าจริงๆจะมี Filter มาจากอะไรก็ตาม)
ดังนั้นถ้าเจอสูตรว่า ALL จึงต้องดูให้ดีด้วยว่าใช้ในฐานะอะไร ดังนั้นเพื่อไม่ให้สับสน การจะปลด Filter เฉยๆ เค้าเลยนิยมใช้ REMOVEFILTERS แทนเพราะชัดเจนกว่า
แล้วถ้าเราเขียนทุกอย่างปนกันล่ะ?
CALCULATE มีวิธีการจัดการ Filter พวกนี้ยังไง? แล้ว Filter Context เดิมล่ะ? แล้วยังมีการปลด Filter ได้อีก? ถ้าเขียนทุกอย่างผสมกันหมดเลยล่ะ จะเป็นไง?
การจะเข้าใจเรื่องพวกนี้ได้อย่างลึกซึง เราจะต้องแบ่งเรื่องของ Filter ออกเป็นกลุ่มๆ ดังนี้ก่อน
- Filter Context ดั้งเดิมของจุดที่สนใจ (รวมถึง Filter Context ของ CALCULATE ชั้นนอกด้วย)
- Row Context ดั้งเดิม
- เงื่อนไข Filter Argument (ที่จริงๆ คือตาราง) ที่ตั้งใจเขียนใน CALCULATE ตัวนั้นๆ
- CALCULATE Modifier เช่น REMOVEFILTERS, ALL, ALLSELECTED, ALLEXCEPT, USERELATIONSHIP, CROSSFILTER
พอแบ่งเป็นกลุ่มได้แล้ว CALCULATE จะทำงานแบบนี้
- CALCULATE จะพิจารณา Filter Argument (ที่จริงๆ คือตาราง) ในกลุ่ม 3 (พิจารณาในสภาวะของ Filter Context และ Row Context เดิม) เก็บไว้ในใจก่อน แม้จะพิจารณาแต่แรก แต่จะเก็บเอาไว้ใช้ตอนหลังสุด
- CALCULATE จะ Copy Filter Context กลุ่ม 1 ออกมาสร้างเป็น New Filter Context
- CALCULATE จะ แปลง Row Context กลุ่ม 2 ให้กลายเป็นส่วนหนึ่งใน Filter ของ New Filter Context ผ่านกระบวนการ Context Transition
- CALCULATE จะทำตาม CALCULATE Modifier ในกลุ่ม 4 (เช่น ปลด Filter, เปลี่ยนเส้น Relationship)
- CALCULATE จะนำ Filter Argument ที่เก็บไว้ตั้งแต่ขั้นตอนแรกมาใช้ในตอนจบ (หลัง CALCULATE Modifier)
- ถ้ามีการพูดถึง Field ที่ไม่เคยมีใน New Filter Context ก็จะเป็นการ Add เงื่อนไขเพิ่ม
- ถ้ามีการพูดถึง Field ที่เคยมีใน New Filter Context จะแบ่งเป็น 2 กรณี
- ถ้าพูดถึงแบบปกติ จะเป็นการแทนค่าด้วยเงื่อนไขใหม่ทันที
- ถ้ามีการใช้ KEEPFILTERS ด้วย จะยังเก็บเงื่อนไขเดิมไว้ ไม่แทนค่าทับ (กลายเป็นเงื่อนไขแบบ AND)
ตัวอย่างการไล่ Step การทำงานของ CALCULATE
สมมติผมเขียน Measure ใหม่ดังนี้ แล้วมาทำความเข้าใจกันว่าเกิดอะไรขึ้น
Case Study 1 : CALCULATE 2 เงื่อนไข มีซ้ำ 1
CustPerson buy Contoso Total Qty =
CALCULATE([Total Qty],
Customer[Customer Type]="Person",
'Product'[Brand]="Contoso")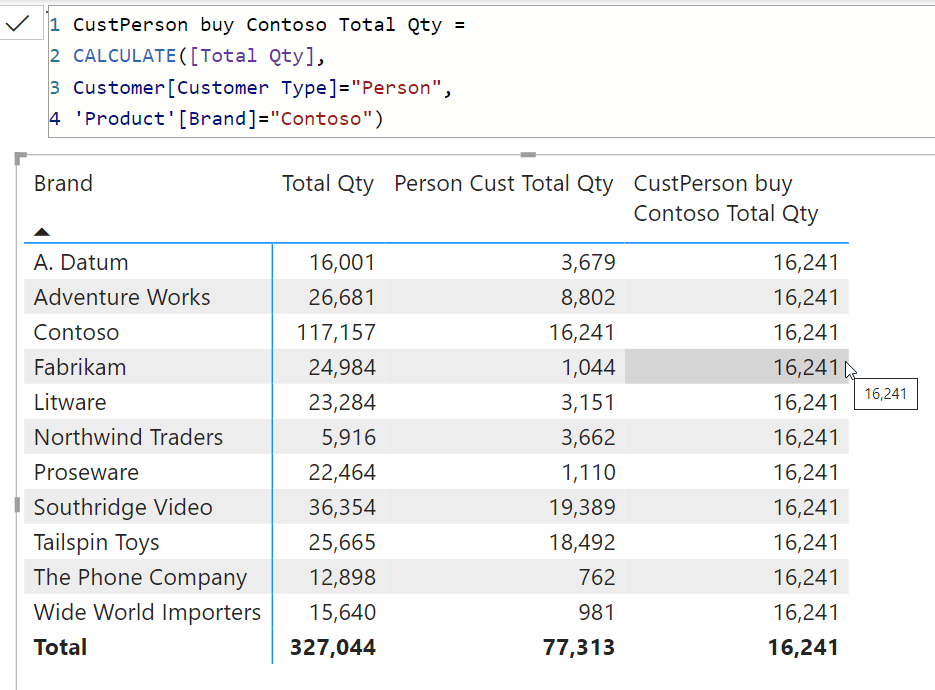
ในจุดที่ผมเอา Mouse ชี้ไว้ เรามาพิจารณากันว่ามีอะไรบ้าง
แบ่งกลุ่ม
- Filter Context ดั้งเดิมของจุดที่สนใจ (รวมถึง Filter Context ของ CALCULATE ชั้นนอกด้วย)
- ‘Product'[Brand] = “Fabrikam”
- Row Context ดั้งเดิม
- ไม่มี
- เงื่อนไข Filter Argument (ที่จริงๆ คือตาราง) ที่ตั้งใจเขียนใน CALCULATE ตัวนั้นๆ
- ‘Product'[Brand] = “Contoso”
- Customer[Customer Type] = “Person”
- CALCULATE Modifier เช่น REMOVEFILTERS, ALL, ALLSELECTED, ALLEXCEPT, USERELATIONSHIP, CROSSFILTER
- ไม่มี
ขั้นตอนการทำงาน
- เก็บ Filter Argument เอาไว้ในใจ
- ‘Product'[Brand] = “Contoso”
- Customer[Customer Type] = “Person”
- Copy Filter Context เดิมมาเป็น New Filter Context
- ‘Product'[Brand] = “Fabrikam”
- ไม่มี Row Context
- ไม่มี CALCULATE Modifier
- เอา Filter Argument ที่เก็บไว้มาใช้ สรุปแล้ว New Filter Context ได้แบบนี้
- ‘Product'[Brand] = “Fabrikam” จะถูกแทนด้วย ‘Product'[Brand] = “Contoso” (จาก Filter Argument )
- Customer[Customer Type] = “Person”
สรุป
เหลือเงื่อนไข 2 อัน คือ
- ‘Product'[Brand] = “Contoso”
- Customer[Customer Type] = “Person”
ตัวอย่างนี้อาจจะยังง่ายๆ อาจยังไม่เห็นความจำเป็นที่ต้องมาคิดละเอียด แต่มันคือการฝึกคิดให้เป็นระบบ เดี่ยวเราลองมาดูตัวอย่างที่ซับซ้อนขึ้นกันครับ
Case Study 2 : CALCULATE ซ้อนกัน
สมมติว่าเดิมที่ผมเขียน Measure เอาไว้แล้วแบบนี้ คือสั่งให้ Brand เป็น Contoso
Contoso Total Qty = CALCULATE([Total Qty],'Product'[Brand]="Contoso")แล้วผมก็เขียน Measure อีกตัวเรียกใช้ Measure ตัวนั้น แต่ดันให้ Brand เป็น Litware
Litware Call Contoso Total Qty =
CALCULATE([Contoso Total Qty],
'Product'[Brand]="Litware")
แบบนี้ผลลัพธ์จะเป็นยังไง? ในเมื่อสิ่งที่ต้องการมันดู Conflict กัน… แล้วมันจะเชื่อตัวไหน หรือมีวิธีคิดยังไง?
เรามาดูผลลัพธ์กันก่อนครับ ปรากฏว่าผลลัพธ์ออกมาเหมือน Filter เป็น Brand Contoso เลย… ทำไมล่ะ? แล้ว Litware ที่เราสั่งล่ะ??

ถ้าพิจารณาดีๆ แล้ว โปรแกรมจะมองสูตรของเราเป็น CALCULATE ซ้อนกันครับ ซึ่งมองเป็นแบบนี้ได้
Litware Call Contoso Total Qty =
CALCULATE(
    CALCULATE([Total Qty],
    'Product'[Brand]="Contoso"),
'Product'[Brand]="Litware")
ซึ่งปกติแล้ว เวลาเขียนฟังก์ชันซ้อนกัน เราต้องคิดตัวในก่อนจริงมั้ยครับ? ซึ่งก็คิดตัวในก่อนเนี่ยถูกแล้ว แต่มันลึกซึ้งตรงที่ข้างในดันเป็น CALCULATE ที่มีนิสัยต้องพิจารณา Filter Context รอบนอกก่อนจะคำนวณนี่สิ
นั่นคือ CALCULATE ตัวใน จะพิจารณา Filter Context ที่มีผลจาก CALCULATE ตัวนอกด้วยนั่นเองดังนี้
สมมติว่าดูบรรทัด Fabrikam แล้วกันนะครับ เราจะพิจารณาว่าทำไมได้ 117,157
แบ่งกลุ่ม
- Filter Context ดั้งเดิมของจุดที่สนใจ (รวมถึง Filter Context ของ CALCULATE ชั้นนอกด้วย)
- ‘Product'[Brand] = “Fabrikam” (จาก Visual)
- ‘Product'[Brand] = “Litware” (จาก CALCULATE ตัวนอก ซึ่งก็คิดแล้วทับเงื่อนไข Fabrikam จาก Visual ไปเรียบร้อย…)
- Row Context ดั้งเดิม
- ไม่มี
- เงื่อนไข Filter Argument (ที่จริงๆ คือตาราง) ที่ตั้งใจเขียนใน CALCULATE ตัวนั้นๆ
- ‘Product'[Brand] = “Contoso”
- CALCULATE Modifier เช่น REMOVEFILTERS, ALL, ALLSELECTED, ALLEXCEPT, USERELATIONSHIP, CROSSFILTER
- ไม่มี
ขั้นตอนการทำงาน
- เก็บ Filter Argument เอาไว้ในใจ
- ‘Product'[Brand] = “Contoso”
- Copy Filter Context เดิมมาเป็น New Filter Context
- ‘Product'[Brand] = “Litware” (จาก CALCULATE ตัวนอก)
- ไม่มี Row Context
- ไม่มี CALCULATE Modifier
- เอา Filter Argument ที่เก็บไว้มาใช้ สรุปแล้ว New Filter Context ได้แบบนี้
- ‘Product'[Brand] = “Litware” (จาก CALCULATE ตัวนอก) เดิม จะถูกแทนด้วย ‘Product'[Brand] = “Contoso” (จาก Filter Argument )
สรุป
เหลือเงื่อนไข 1 อัน คือ
- ‘Product'[Brand] = “Contoso”
Case Study 3 : เขียน 2 เงื่อนไข Conflict กันตรงๆ
สมมติผมดันเขียนเงื่อนไขที่ Conflict กันเอง ใน CALCULATE เดียวกันบ้าง จะเป็นยังไง?
Contoso Litware Total Qty =
CALCULATE([Total Qty],
'Product'[Brand]="Contoso",
'Product'[Brand]="Litware")
เราเขียนให้ Brand เป็น Contoso และก็ Brand เป็น Litware ซึ่งเห็นผลลัพธ์เลยว่าได้ค่าออกมาเป็น Blank นั่นคือมันไม่มีค่าแบบนี้นั่นเอง
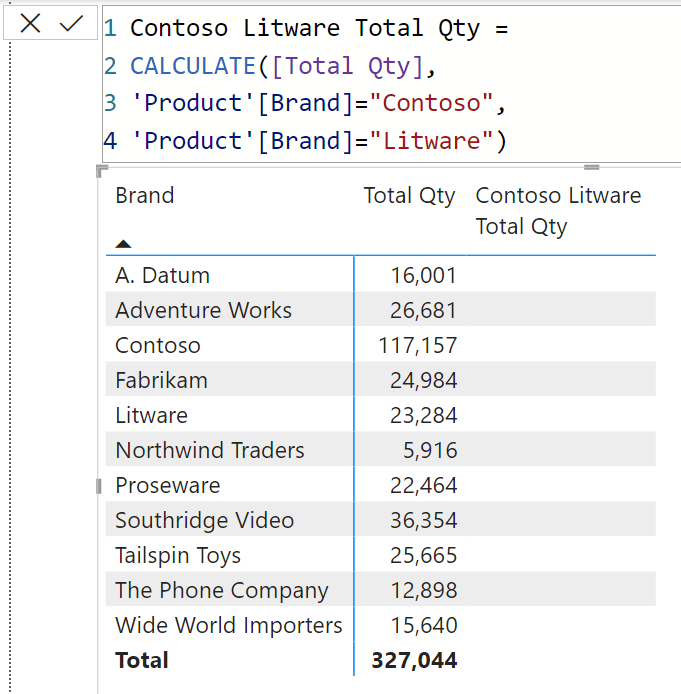
ทั้งนี้เพราะในขั้นตอนสุดท้ายของ CALCULATE มันเอาเงื่อนไข 2 อันนี้ มาเชื่อมกันแบบ AND มันก็เลยไม่มีผลลัพธ์ตารางใดๆ ออกมาเลยนั่นเอง
- ‘Product'[Brand]=”Contoso”
- ‘Product'[Brand]=”Litware”
ผลลัพธ์สุดท้ายเลยได้ Blank ไปโดยปริยาย
Case Study 4 : การใช้ USERELATIONSHIP
สมมติว่าผมสามารถคำนวณ Total Qty โดย แบ่งตาม Year และ Month ใน Date Table แบบนี้เราสามารถตีความได้ว่าเป็น Total Qty ของแต่ละเดือน/ปี ที่ Order สินค้า ทั้งๆ ที่ไม่ได้เขียนระบุไว้ที่ไหนเลย
สาเหตุที่เป็นแบบนี้เพราะเส้น Relationship ที่ Active อยู่คือเส้นที่เชื่อมระหว่าง Date ของ Date Table -> Order Date ใน OrderDetail นั่นเอง
แต่ถ้าหากผมต้องการสร้าง Measure อีกตัวเป็นการคำนวณ Total Qty โดยแบ่งตาม แต่ละเดือน/ปี ที่ Deliver สินค้า ผมจะต้องเขียน Measure ดังนี้
Total Qty Delivery = CALCULATE([Total Qty],
USERELATIONSHIP(dDate[Date],OrderDetail[DeliveryDate]))
เราจะได้เลข Total Qty ที่ยึดจาก Delivery Date ออกมาในเฉพาะ Measure นี้โดยไม่ต้องไปแก้ที่ Data Model เลย (การแก้ Data Model จะกระทบต่อการ Filter Date ทั้งหมด ซึ่งอาจจะไม่ใช่สิ่งที่เราต้องการ)
สมมติว่าผมอยู่ที่เดือน March ของ 2019 นะครับ เรามาดูว่าทำไมผลลัพธ์ถึง Work?
แบ่งกลุ่ม
- Filter Context ดั้งเดิมของจุดที่สนใจ (รวมถึง Filter Context ของ CALCULATE ชั้นนอกด้วย)
- dDate[Year]=2019
- dDate[Month Name]=”March”
- Row Context ดั้งเดิม
- ไม่มี
- เงื่อนไข Filter Argument (ที่จริงๆ คือตาราง) ที่ตั้งใจเขียนใน CALCULATE ตัวนั้นๆ
- ไม่มี
- CALCULATE Modifier เช่น REMOVEFILTERS, ALL, ALLSELECTED, ALLEXCEPT, USERELATIONSHIP, CROSSFILTER
- USERELATIONSHIP สั่งให้เปลี่ยนเส้นเป็น Delivery Date
ขั้นตอนการทำงาน
- เก็บ Filter Argument เอาไว้ในใจ
- ไม่มี
- Copy Filter Context เดิมมาเป็น New Filter Context
- dDate[Year]=2019
- dDate[Month Name]=”March”
- ไม่มี Row Context
- CALCULATE Modifier
- USERELATIONSHIP สั่งให้เปลี่ยนเส้นเป็น Delivery Date
- สรุปแล้ว New Filter Context ได้แบบนี้
- dDate[Year]=2019
- dDate[Month Name]=”March”
- แต่ต่างจาก Context ดั้งเดิมตรงที่เรามีการเปลี่ยนเส้น Relationship แล้วใน Step ก่อนหน้านี้ มันจึงกลายเป็น Year และ Month Name ที่ Deliver ของนั่นเอง
จริงๆ แล้วเงื่อนไขใน Filter ของ CALCULATE คือ Table
การที่เราเขียนเงื่อนไขใน Filter ของ CALCULATE เช่น
Contoso Total Qty = CALCULATE([Total Qty],
'Product'[Brand]="Contoso")
นั้นจริงๆ แล้วมันคือตัวย่อของการเขียนแบบนี้ (โปรแกรมมันจะแปลงสูตรข้างบนให้กลายเป็นแบบนี้ก่อนจะลงมือคำนวณ ดังนั้นจึงไม่ต่างกันด้าน performance เลย)
Contoso Total Qty Full = CALCULATE([Total Qty],
FILTER(ALL('Product'[Brand]),'Product'[Brand]="Contoso") )
หากเรามาคิดว่าการเขียนว่า
FILTER(ALL('Product'[Brand]),'Product'[Brand]="Contoso")แบบนี้มันจะได้ผลเป็นยังไง?
- ALL(‘Product'[Brand]) จะสร้างตารางรายชื่อ Brand ที่มีครบทุก Brand เสมอ
- แล้ว FILTER ก็ใส่เงื่อนไขให้ตารางนั้นเหลือแค่ Contoso ค่าเดียว
เราจะพบว่ามันก็จะได้ ผลเป็นตาราง ที่มี 1 คอลัมน์คือ ‘Product'[Brand] และมี 1 ค่า คือ Contoso นั่นเอง (ไม่ว่าจะอยู่จุดไหนของรายงาน) ดังนั้นเราก็เลยเห้นทุก Brand ได้ค่าเท่ากับ Contoso หมดเลย
ซึ่งหากเราเปลี่ยนมุมมองเรื่องของ Filter ของ CALCULATE จากการมองว่า Filter มันเป็นแค่ “เงื่อนไข” ให้มองเป็น “ตาราง” แทน ทุกอย่างจะเป็นไปได้มากขึ้นอีกเยอะมาก ซึ่งจะได้เห็นใน Case Study ต่อจากนี้นะครับ
Case Study 5 : การคิด % เทียบกับ Product Category ใหญ่ แบบยืดหยุ่น
สมมติว่าผมต้องการคิดว่ายอด Total Qty ที่มีคิดเป็นกี่ % ของ Category ใหญ่ ผมจะต้องคำนวณยอด Category ใหญ่(ที่เป็นตัวหาร) ให้ถูกต้องให้ได้ก่อน เช่น ถ้า Matrix เป็นแบบนี้ ผมอาจจะใช้การ REMOVEFILTERS ที่ตัวย่อยมาช่วย
Total Qty All Subcat = CALCULATE([Total Qty],
REMOVEFILTERS(ProductCategory[Subcategory])) 
แต่การทำแบบนี้มีข้อเสียคือ ถ้าผมเปลี่ยนตัวย่อยเป็นตัวอื่น Measure นั้นก็จะไม่ Work หรือถ้าผมไม่ใส่ตัว Product Category เข้าไปด้วยมันก็จะไม่ Work อยู่ดี เช่นแบบนี้ เราจะได้ยอด 327,044 ซึ่งเป็นยอดรวมทั้งหมดมาแทน ไม่ใช่ยอดของ ProductCategory นั้นๆ

ดังนั้นวิธีการจัดการ เราจะต้องใช้ความเข้าใจที่ลึกซึ้งขึ้น ว่าจริงๆ เงื่อนไข Filter ของ CALCULATE คือ Table ดังนั้นผมจะสามารถเขียนแบบนี้ได้ ซึ่งผมจะได้ผลลัพธ์เป็นยอดของ Category นั้นๆ เสมอ ไม่ว่าผมจะใส่ Product Category เข้าไปด้วยหรือไม่ก็ตาม
Total Qty Category Level = CALCULATE([Total Qty],
REMOVEFILTERS('Product'),
DISTINCT(ProductCategory[Product Category]))
ปล. ถ้าข้อมูลสมบูรณ์ดี ใช้ DISTINCT(ProductCategory[Product Category]) หรือ VALUES(ProductCategory[Product Category]) ก็ได้

ทีนี้เรามาทำความเข้าใจกันว่าทำไมสูตรนี้จึง Work โดยไล่ที่ละขั้นตอนตามที่ผมบอกไป สมมติว่าดูที่ Desktops
แบ่งกลุ่ม
- Filter Context ดั้งเดิมของจุดที่สนใจ (รวมถึง Filter Context ของ CALCULATE ชั้นนอกด้วย)
- ProductCategory[Subcategory]=”Desktops”
- Row Context ดั้งเดิม
- ไม่มี
- เงื่อนไข Filter Argument (ที่จริงๆ คือตาราง) ที่ตั้งใจเขียนใน CALCULATE ตัวนั้นๆ
- DISTINCT(ProductCategory[Product Category])
- CALCULATE Modifier เช่น REMOVEFILTERS, ALL, ALLSELECTED, ALLEXCEPT, USERELATIONSHIP, CROSSFILTER
- REMOVEFILTERS(‘Product’)
ขั้นตอนการทำงาน
- เก็บ Filter Argument เอาไว้ในใจ
- DISTINCT(ProductCategory[Product Category])
- ซึ่งจะมองเห็น Product Category ภายใต้ Filter Context เดิมนั่นคือจะเห็นแค่ Computers เท่านั้น
- จึงเปรียบเสมือนว่าเราได้เงื่อนไขออกมาว่า ProductCategory[Product Category]=”Computers” นั่นเอง
- DISTINCT(ProductCategory[Product Category])
- Copy Filter Context เดิมมาเป็น New Filter Context
- ProductCategory[Subcategory]=”Desktops”
- ไม่มี Row Context
- CALCULATE Modifier
- REMOVEFILTERS(‘Product’) ส่งผลให้ปลด Filter ทั้งหมดของ Expanded Table จากตาราง Product (ตาราง Product รวมถึงทุกตารางที่เชื่อมกับมันที่เป็นฝั่งเลข 1) นั่นคือจะปลดทั้งตาราง Product และ ตาราง Product Category ไปด้วย
- ดังนั้น New Filter Context จึงหายไปหมด
- เอา Filter Argument ที่เก็บไว้มาใช้ สรุปแล้ว New Filter Context ได้แบบนี้
- ProductCategory[Product Category]=”Computers”
นั่นคือสรุปแล้ว มี 1 เงื่อนไขซึ่งเป็น Category ใหญ่ของสิ่งที่เรากำลังดูอยู่นั่นเอง
Case Study 6 : Time Intelligence ทำงานยังไงกันแน่?
สมมติว่าผมต้องการใช้ฟังก์ชัน Time Intelligence เช่น พวก YTD อย่าง TOTALYTD หรือตัวเต็มของมันคือ CALCULATE+DATESYTD จะได้แบบนี้
Total Qty YTD = CALCULATE([Total Qty],DATESYTD(dDate[Date]))Total Customer YTD = CALCULATE([Total Customer],DATESYTD(dDate[Date]))หากคิดแบบผิวเผินหลายคนจะคิดว่าการใช้ YTD คือการเอาค่ามาสะสมกันตั้งแต่ต้นปี แต่ในความเป็นจริงๆ มันไม่ใช่การสะสมค่า แต่เป็นการ “เปลี่ยนช่วงเวลาใน Filter Context” ให้กลายเป็นช่วงใหม่ต่างหาก
สังเกตได้ชัดจาก Total Customer YTD ในเดือน April 2019 ซึ่งไม่ใช่การเอาจำนวนลูกค้าใน 4 เดือนมารวมกัน แต่เป็นการคิดจำนวนลูกค้าในช่วง 4 เดือนแบบไม่ซ้ำต่างหาก
ที่เจ้า Total Qty YTD มันดูเหมือนเป็นการสะสมค่าตั้งแต่ต้นปี เป็นเพราะบังเอิญที่เราใช้ Measure ที่คำนวณด้วยการ SUM ต่างหาก
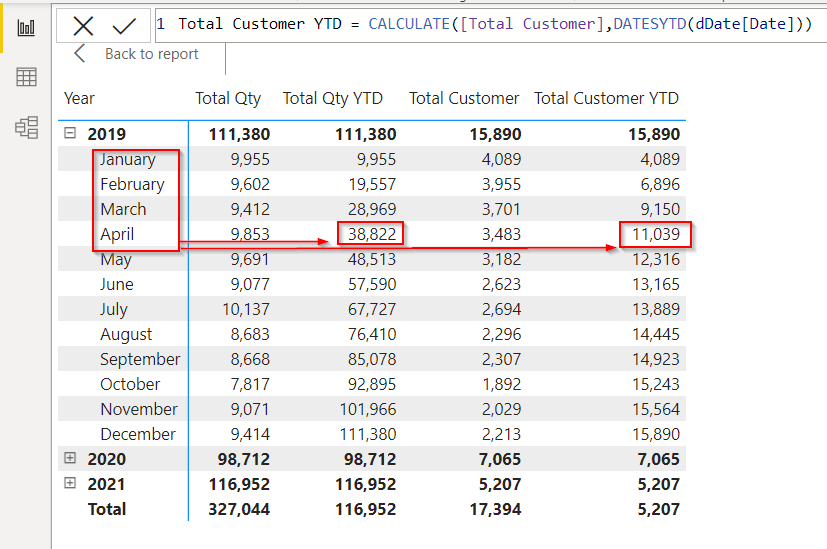
อีกเรื่องที่น่าสนใจคือช่วงเวลาที่มันคิด YTD คือช่วงเวลาไหน หลายคนก็จะไม่รู้ตรงนี้ เช่นตรงบรรทัด Total สุดท้าย ที่ไม่มี Filter เรื่องวันที่เลย ทำไมถึงได้เป็น 5207 เท่ากับปี 2021 เลย?
สาเหตุเป็นเพราะ YTD จะไปสร้างช่วงวันที่ Date ใหม่ขึ้นมา โดยยึดวันสุดท้ายใน Filter Context เป็นหลักก่อน แล้วเปลี่ยนจุดเริ่มต้นให้เป็นต้นปีเดียวกับวันสุดท้ายนั้นๆ นั่นเอง เรื่องพวกนี้เราก็ต้องไปทำความเข้าใจความสามารถของฟังก์ชัน Time Intelligence แต่ละตัวอีกที เพราะความสามารถในการสร้างช่วงวันที่ของมันไม่เหมือนกัน
แต่เรื่องที่น่าสนใจก็คือ หากคิดตามหลักการที่ผมสอนแล้ว ฟังก์ชัน Time Intelligence มันไม่น่าจะทำงานได้ถูกต้องนี่นา เราลองมาไล่ Step กัน สมมติว่าดูที่ April 2019
แบ่งกลุ่ม
- Filter Context ดั้งเดิมของจุดที่สนใจ (รวมถึง Filter Context ของ CALCULATE ชั้นนอกด้วย)
- dDate[Year]=2019
- dDate[Month Name]=”April”
- Row Context ดั้งเดิม
- ไม่มี
- เงื่อนไข Filter Argument (ที่จริงๆ คือตาราง) ที่ตั้งใจเขียนใน CALCULATE ตัวนั้นๆ
- dDate[Date] อยู่ในช่วง 1/1/2019 – 30/4/2019 (อันนี้คือตารางที่เกิดจาก Time Intelligence DATESYTD)
- CALCULATE Modifier เช่น REMOVEFILTERS, ALL, ALLSELECTED, ALLEXCEPT, USERELATIONSHIP, CROSSFILTER
- ไม่มี
ขั้นตอนการทำงาน
- เก็บ Filter Argument เอาไว้ในใจ
- dDate[Date] อยู่ในช่วง 1/1/2019 – 30/4/2019 (ตารางที่เกิดจาก Time Intelligence DATESYTD)
- Copy Filter Context เดิมมาเป็น New Filter Context
- dDate[Year]=2019
- dDate[Month Name]=”April”
- ไม่มี Row Context
- ไม่มีCALCULATE Modifier
- เอา Filter Argument ที่เก็บไว้มาใช้ สรุปแล้ว New Filter Context ได้แบบนี้
- dDate[Year]=2019
- dDate[Month Name]=”April”
- dDate[Date] อยู่ในช่วง 1/1/2019 – 30/4/2019
ถ้าเรามองแบบนี้ ผลลัพธ์จะยังต้องเป็นช่วงเวลา April 2019 อยู่ดี เพราะทุกเงื่อนไขต้องเอามา AND กันหมด (เนื่องจากพูดถึงคนละ Field กัน) แล้วทำไมผลลัพธ์มันถึงกลายเป็น ช่วง 1/1/2019 – 30/4/2019 ไปได้ล่ะ?
สาเหตุก็คือ เวลาที่เราเรียกใช้ฟังก์ชัน Time Intelligence หรือมีการอ้างอิงเงื่อนไขใน CALCULATE ไปที่คอลัมน์ Date ของ Date Table (โดยมีการ Mark as Date Table หรือ Relationship เชื่อมที่วันที่) โปรแกรมจะแอบปลด Filter ทั้ง Date Table ให้เราโดยอัตโนมัติ ดังนั้นจริงๆ แล้วผลการวิเคราะห์จะกลายเป็นแบบนี้
แบ่งกลุ่ม
- Filter Context ดั้งเดิมของจุดที่สนใจ (รวมถึง Filter Context ของ CALCULATE ชั้นนอกด้วย)
- dDate[Year]=2019
- dDate[Month Name]=”April”
- Row Context ดั้งเดิม
- ไม่มี
- เงื่อนไข Filter Argument (ที่จริงๆ คือตาราง) ที่ตั้งใจเขียนใน CALCULATE ตัวนั้นๆ
- dDate[Date] อยู่ในช่วง 1/1/2019 – 30/4/2019 (อันนี้คือตารางที่เกิดจาก Time Intelligence DATESYTD)
- CALCULATE Modifier เช่น REMOVEFILTERS, ALL, ALLSELECTED, ALLEXCEPT, USERELATIONSHIP, CROSSFILTER
- REMOVEFILTERS(dDate)
ขั้นตอนการทำงาน
- เก็บ Filter Argument เอาไว้ในใจ
- dDate[Date] อยู่ในช่วง 1/1/2019 – 30/4/2019 (ตารางที่เกิดจาก Time Intelligence DATESYTD)
- Copy Filter Context เดิมมาเป็น New Filter Context
- dDate[Year]=2019
- dDate[Month Name]=”April”
- ไม่มี Row Context
- CALCULATE Modifier
- REMOVEFILTERS(dDate)
ซึ่งจะปลดเงื่อนไข 2 อันนี้ออกไปหมด- dDate[Year]=2019 และ
- dDate[Month Name]=”April”
- REMOVEFILTERS(dDate)
- เอา Filter Argument ที่เก็บไว้มาใช้ สรุปแล้ว New Filter Context ได้แบบนี้
- dDate[Date] อยู่ในช่วง 1/1/2019 – 30/4/2019
Case Study 7 : YTD แบบนับเฉพาะวันจันทร์
หลังจากที่เราเข้าใจ Time Intelligence มากขึ้นแล้ว ว่ามันปลด Filter ทั้ง Date Table ให้เราด้วย เราลองมาทำความเข้าใจต่อว่าจะเกิดอะไรขึ้น ถ้าเราอยากคิดยอดสินค้าสะสมตั้งแต่ต้นปี แต่นับเฉพาะวันจันทร์…

เราจะพบว่าผลลัพธ์ของ YTD นั้นดูไม่ใช่การสะสมค่าเฉพาะวันจันทร์อย่างแน่นอน เพราะเลขมันเยอะมากๆ เลยเมื่อเทียบกับ Total Qty เฉพาะวันจันทร์
ก่อนจะแก้ไขปัญหาได้ เราจะต้องเข้าใจปัญหาซะก่อน ว่ามันเกิดอะไรขึ้น? ดังนั้นเราลองมาวิเคราะห์กันว่าทำไมเดือน April 2019 ถึงได้ 38,511? (ซึ่งเยอะมากๆ แต่ก็ยังน้อยกว่า YTD อันเดิมที่ยังไม่ Filter วันจันทร์ แล้วได้ 38,822)
ถ้ามาไล่ดูว่ามันทำงานยังไง จะเป็นแบบนี้
แบ่งกลุ่ม
- Filter Context ดั้งเดิมของจุดที่สนใจ (รวมถึง Filter Context ของ CALCULATE ชั้นนอกด้วย)
- dDate[Year]=2019
- dDate[Month Name]=”April”
- dDate[DayName]=”Monday”
- Row Context ดั้งเดิม
- ไม่มี
- เงื่อนไข Filter Argument (ที่จริงๆ คือตาราง) ที่ตั้งใจเขียนใน CALCULATE ตัวนั้นๆ
- dDate[Date] อยู่ในช่วง 1/1/2019 – จันทร์สุดท้ายของเดือน April (อันนี้คือตารางที่เกิดจาก Time Intelligence DATESYTD)
- CALCULATE Modifier เช่น REMOVEFILTERS, ALL, ALLSELECTED, ALLEXCEPT, USERELATIONSHIP, CROSSFILTER
- REMOVEFILTERS(dDate)
ขั้นตอนการทำงาน
- เก็บ Filter Argument เอาไว้ในใจ
- dDate[Date] อยู่ในช่วง 1/1/2019 – จันทร์สุดท้ายของเดือน April (ตารางที่เกิดจาก Time Intelligence DATESYTD)
- Copy Filter Context เดิมมาเป็น New Filter Context
- dDate[Year]=2019
- dDate[Month Name]=”April”
- dDate[DayName]=”Monday”
- ไม่มี Row Context
- CALCULATE Modifier
- REMOVEFILTERS(dDate)
ซึ่งจะปลดเงื่อนไข 3 อันนี้ออกไปหมด- dDate[Year]=2019 และ
- dDate[Month Name]=”April”
- dDate[DayName]=”Monday”
- REMOVEFILTERS(dDate)
- เอา Filter Argument ที่เก็บไว้มาใช้ สรุปแล้ว New Filter Context ได้แบบนี้
- dDate[Date] อยู่ในช่วง 1/1/2019 – จันทร์สุดท้ายของเดือน April
จะเห็นว่าผลลัพธ์ไม่ได้เหลือแค่วันจันทร์ ได้แต่ข้อมูลตั้งแต่ต้นปีถึงวันจันทร์สุดท้ายที่มองเห็นต่างหาก สาเหตุเพราะมันถูกปลดเงื่อนไขไปจากการปลด Filter Date ทั้งตารางแบบอัตโนมัตินั่นเอง
ดังนั้นทางแก้ไขคือการใส่ Filter เรื่องวันเข้าไปใหม่ด้วย DISTINCT(dDate[DayName]) ก็ได้ ดังนี้
Total Qty YTD OnlySelectDayname = CALCULATE([Total Qty],
DATESYTD(dDate[Date]),DISTINCT(dDate[DayName]))
แบ่งกลุ่ม
- Filter Context ดั้งเดิมของจุดที่สนใจ (รวมถึง Filter Context ของ CALCULATE ชั้นนอกด้วย)
- dDate[Year]=2019
- dDate[Month Name]=”April”
- dDate[DayName]=”Monday”
- Row Context ดั้งเดิม
- ไม่มี
- เงื่อนไข Filter Argument (ที่จริงๆ คือตาราง) ที่ตั้งใจเขียนใน CALCULATE ตัวนั้นๆ
- dDate[Date] อยู่ในช่วง 1/1/2019 – จันทร์สุดท้ายของเดือน April (อันนี้คือตารางที่เกิดจาก Time Intelligence DATESYTD)
- DISTINCT(dDate[DayName]) ซึ่งจะได้วันที่เลือกมาคือวันจันทร์ เหมือนกับได้ว่า dDate[DayName]=”Monday”
- CALCULATE Modifier เช่น REMOVEFILTERS, ALL, ALLSELECTED, ALLEXCEPT, USERELATIONSHIP, CROSSFILTER
- REMOVEFILTERS(dDate)
ขั้นตอนการทำงาน
- เก็บ Filter Argument เอาไว้ในใจ
- dDate[Date] อยู่ในช่วง 1/1/2019 – จันทร์สุดท้ายของเดือน April (ตารางที่เกิดจาก Time Intelligence DATESYTD)
- DISTINCT(dDate[DayName]) ซึ่งจะได้วันที่เลือกมาคือวันจันทร์ เหมือนกับได้ว่า dDate[DayName]=”Monday”
- Copy Filter Context เดิมมาเป็น New Filter Context
- dDate[Year]=2019
- dDate[Month Name]=”April”
- dDate[DayName]=”Monday”
- ไม่มี Row Context
- CALCULATE Modifier
- REMOVEFILTERS(dDate)
ซึ่งจะปลดเงื่อนไข 3 อันนี้ออกไปหมด- dDate[Year]=2019 และ
- dDate[Month Name]=”April”
- dDate[DayName]=”Monday”
- REMOVEFILTERS(dDate)
- เอา Filter Argument ที่เก็บไว้มาใช้ สรุปแล้ว New Filter Context ได้แบบนี้
- dDate[Date] อยู่ในช่วง 1/1/2019 – จันทร์สุดท้ายของเดือน April
- DISTINCT(dDate[DayName]) ซึ่งจะได้วันที่เลือกมาคือวันจันทร์ เหมือนกับได้ว่า dDate[DayName]=”Monday”
ดังนั้นผลลัพธที่ได้จึงเป็นช่วงต้นปีถึงจันทร์สุดท้ายของเดือนเมษา “และ” เพิ่มเงื่อนไขว่าต้องเป็นวันจันทร์ด้วย ดังนั้น ผลลัพธ์จะเหลือแค่วันจันทร์เท่านั้นนั่นเอง
ต่อตอนต่อไป
ตอนต่อไปจะมีเรื่องที่ซับซ้อนมากขึ้นอีกนั่นคือ Context Transition และเรื่องของการสร้างตารางด้วย CALCULATETABLE มาประกอบด้วยครับ