ThepExcel Logo
  • บทความ
    • Excel
      • Excel ทั่วไป
      • Excel Pivot Table
      • Excel Power Pivot
      • Power Query
      • Excel Array Formula
      • Excel VBA
      • Excel for Business
      • Excel and Maths
      • ฟังก์ชัน Excel ทั้งหมด
    • Power BI
      • Power Query
      • Data Model
      • DAX Formula
      • Power BI Report
    • Coding
      • Excel VBA
      • Python
      • Power Query M Code
    • AI
      • ChatGPT
      • Stable Diffusion
      • MidJourney
    • Highlights : บทความแนะนำ
    • คลิปวีดีโอ
  • อบรม
    • อบรมลูกค้าองค์กร
    • คอร์สออนไลน์ SkillLane
    • แนะนำวิทยากร
    • Excel/Power BI Skill Map
    • Quiz
  • Shop
    • คอร์สออนไลน์
    • สินค้าทั้งหมด
    • หนังสือเล่ม
    • E-Book
    • Cart
  • Download
    • Download ไฟล์จากเทพเอ็กเซล
    • ThepExcel-Mfx : M Code สำเร็จรูป
    • Date Table สำเร็จรูป
    • กราฟ My Skill
    • github.com/ThepExcel
  • รวม Link
    • รวม Link สอน Excel & Power BI ทั้งไทยและเทศ
    • รวม Link เกี่ยวกับ AI
    • รวม Link Coding
    • หนังสือแนะนำ
    • Facebook ThepExcel
    • YouTube ThepExcel
    • DAX Formatter
  • Contact
    • แนะนำ เทพเอ็กเซล (Thep Excel)
    • แนะนำวิทยากร : อาจารย์ ศิระ เอกบุตร (ระ)
    • นโยบายการคุ้มครองข้อมูลส่วนบุคคล (Privacy Policy)
  • Facebook
  • YouTube

Power BI ตอนที่ 17 : วิธีทำรายงานเทียบเป้าหมาย Target vs Actual

target vs actual

Categories 📂

Data Model

Tags 🏷️

actual, target

เนื้อหาตอนนี้คิดว่าเป็นเรื่องที่หลายๆ คนอยากรู้ นั่นก็คือวิธีทำรายงานเทียบเป้าหมาย Target vs Actual โดยที่สามารถจะแสดงข้อมูลใน Visual เดียวกันได้ เทียบได้ว่าค่าจริงต่างจากเป้าหมายเท่าไหร่เป็นต้น

สารบัญ

  • ไฟล์ประกอบ
  • จะทำ Target vs Actual อะไรได้บ้าง?
  • ผูก Data Model ยังไง?
  • เริ่มสร้างตาราง Target ให้ใช้งานได้จริง
    • สร้าง DateKey
    • สร้าง ProductKey
  • ทำ Data Model รองรับ Target vs Actual
  • เริ่มสร้างรายงาน Target vs Actual
  • สารบัญ Series Power BI

ไฟล์ประกอบ

โหลดอันนี้ได้เลย มีไฟล์ Target ให้ด้วยครับ

หน้าตาของไฟล์ Target ของเราเป็นแบบนี้

ถ้าแปลงข้อมูลอันนี้ให้เป็นข้อมูลเชิง Database เราจะสามารถนำไปสร้าง Relationship กับตารางอื่นๆ ใน Data Model ได้

จะทำ Target vs Actual อะไรได้บ้าง?

ไฟล์ Target ของเรามีการแบ่งมิติตาม Year Month และ ProductSubCategory ซึ่งเราจะสามารถทำ Target ตามมิติเหล่านี้ได้อย่างแน่นอน รวมถึงมิติที่ใหญ่กว่าซึ่งเกิดจากผลรวมของตัวเหล่านี้ด้วย เช่น ProductCategory ก็จะสามารถทำได้ไปด้วย

อย่างไรก็ตาม ถ้าหากอยากดูในมิติที่ย่อยลงกว่าเดิม มันขึ้นกับว่ามีวิธี Allocate ค่า Target จากตัวใหญ่ไปตัวย่อยหรือไม่? เช่น ถ้าจะ Allocate ค่าจากรายเดือน เป็นรายวัน ก็น่าจะทำได้ เพราะเอาไปหารจำนวนวันในเดือนก็น่าจะจบ แต่ถ้าจะดู Budget ของสินค้าแต่ละอันเลย จะทำไม่ได้ เพราะไม่มีวิธี Allocate ที่น่าจะดีพอ เป็นต้น

ผูก Data Model ยังไง?

Data Model ของเราน่าจะต้องผูกกับ ตารางวันที่ และ ตารางสินค้าอย่างแน่นอน ซึ่งการจะผูกกับตารางวันที่อย่าง dDate ได้จะต้องใช้ Key เชื่อมที่เป็นระดับวันที่ และจะผูกตารางสินค้าซึ่งตอนนี้เรามี dProduct ได้ ก็จะต้องมี Key ระดับ ProductID นี่คือสิ่งที่ต้องรู้ในการผูก Data Model

สำหรับตารางวันที่ที่ต้องใช้วันเป็นตัวเชื่อม เรายังทำให้ตาราง Target ของเราเพิ่มคอลัมน์วันที่ไปได้ง่ายๆ เช่น เพิ่มให้เป็นวันที่ 1 หรือวันสุดท้ายของแต่ละเดือนไปซะ ก็พอจะเชื่อมได้

แต่ว่าสินค้า ใน Budget เรามีแต่ SubCategory ไม่มีข้อมูล ProductKey ให้ผูกเลย ทางแก้คือ เราต้องหาทางสร้างคอลัมน์ ProductKey ที่เป็นตัวแทนของ SubCategory นั้นๆ มาให้ได้ เพื่อจะเป็น Key ผูกให้ได้นั่นเอง

สรุปแล้ว เราจะต้องเพิ่มคอลัมน์ตัวแทน 2 อัน คือ DateKey และ ProductKey ขึ้นมาในตาราง Target ด้วย

เริ่มสร้างตาราง Target ให้ใช้งานได้จริง

เริ่มจาก Get Data จาก Excel มา แล้ว Promote Header และ Fill Down ProductSubCategory ซะ จากนั้นลบคอลัมน์ Grand Total ด้านขวาสุดออก

จากนั้นเลือกคอลัมน์ ProductSubcategory และ Year จากนั้นคลิ๊กขวา Unpivot Other Columns ลงมาซะ

เปลี่ยนชื่อคอลัมน์ให้เรียบร้อย

สร้าง DateKey

ทีนี้เราจะสร้างคอลัมน์ใหม่เพื่อให้เป็นวันที่วันแรกของเดือน วิธีที่ง่ายที่สุดคือสร้างคอลัมน์ใหม่ด้วย Column From Example จาก Year และ Month แบบนี้

จากนั้นกดเปลี่ยนประเภทข้อมูลให้เป็น Date ซะ (ถ้าไม่ได้ให้กด Using Locale)

สร้าง ProductKey

การจะหา ProductKey มาเป็นตัวแทนของแต่ละ SubCategory วิธีที่ง่ายที่สุดคือสร้าง Query อีกตัวแล้ว Reference ค่าจาก dProduct ออกมาก่อน

ทำให้เหลือแค่ ProductKey และ ProductSubcategory โดยเลือก 2 ตัวนี้แล้วกด Remove Other Columns

จากนั้นสั่ง Remove Duplicates ที่คอลัมน์ ProductSubcategory ซะ

จากนั้นเปลี่ยนชื่อ Query เป็น MapProductKey ซะ แล้วเลือกเอา Enable Load ออกด้วย เพราะเราจะไม่เอาผลลัพธ์ตารางนี้ออกไปยัง Data Model

จากนั้นกลับไปยัง Target แล้วสั่ง Merge กับ MapProductKey เพื่อจะดึงค่า ProductKey ที่เป็นตัวแทนของแต่ละ ProductSubcategory มายังตาราง Target

จากนั้นแตกเอาคอลัมน์ ProductKey ออกมาอันเดียวก็จบ

เปลี่ยนชื่อ Query ให้เป็น fTarget ซะ แล้วกด Close & Apply

ทำ Data Model รองรับ Target vs Actual

จากนั้นก็ผูก Date กับ DateKey เข้าด้วยกันซะ (เพราะชื่อคอลัมน์ไม่ตรงกัน เราเลยต้องทำเอง) สุดท้ายจะได้ Data Model แบบนี้ ซึ่งแปลว่า dDate และ dProduct สามารถ Filter ได้ทั้ง fSales และ fTarget พร้อมๆ กันแล้ว (ดูทิศทางการ Filter จากลูกศร)

ซึ่ง Model แบบนี้ก็คือ Model ที่มี Fact Table 2 ตาราง (ขึ้นไป) นั่นเอง แต่เป็นแบบที่ไม่ได้ผูกกันเองนะ แต่ผูกผ่าน Dimension Table อื่นๆ เช่น dDate กับ dProduct

เริ่มสร้างรายงาน Target vs Actual

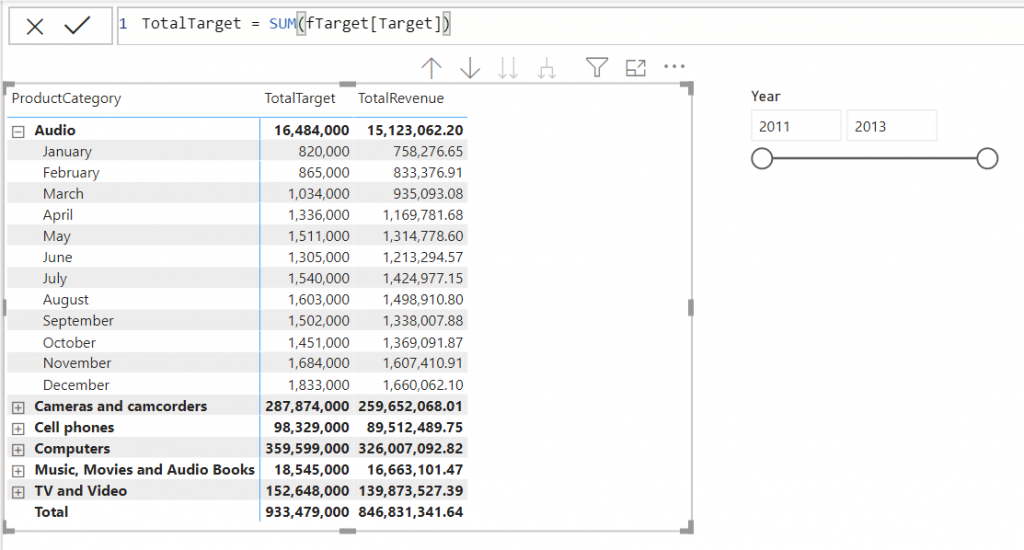
ให้เราสร้าง Measure ที่ชื่อว่า TotalTarget ขึ้นมา โดยใช้สูตรที่ง่ายที่สุดในโลกอย่าง SUM ธรรมดาๆ

TotalTarget = SUM(fTarget[Target])

จากนั้นก็สามารลาก TotalTarget เข้า Visual ได้แล้ว และจะเห็นว่าเราสามารถลาก Dimension ที่มีความละเอียดเทียบเท่าหรือใหญ่กว่า Dimension ในตาราง fTarget ได้สบายๆ เช่น ProductCategory นั้นหยาบกว่า สามารถใช้ได้เลย รวมถึง MonthName ที่มีความละเอียดเทียบเท่ากันด้วย

และแน่นอนว่าถ้าจะทำคำนวณพวก % Achievement นั้นก็ง่ายเหลือเกิน แค่เอา Actual มาหารด้วย Target

%AchieveTarget = DIVIDE([TotalRevenue],[TotalTarget])

จากนั้นจะทำ Visual เป็นกราฟแบบไหนก็แล้วแต่คุณแล้ว

ซึ่งจะใช้พวก Custom Visual มาช่วยก็ได้กราฟเท่ๆ ไปอีกแบบนึง เช่น อันนี้เป็น Custom Visual ชื่อว่า Bullet Chart by OKViz ครับ ซึ่งทำให้ประหยัดเนื้อที่เรื่อง Target ไปได้เยอะเลย เพราะเหลือแค่ขีดเอง

เดี๋ยวบทความนี้เราจะขอจบเท่านี้ก่อนดีกว่า (เริ่มยาวละ) ในตอนต่อไปผมจะมาแนะนำวิธี Allocate Target กรณีที่จะดูในมิติที่ย่อยกว่าในตาราง fTarget ที่ทำไว้นะครับ

สารบัญ Series Power BI

  • POWER BI ตอนที่ 01: POWER BI คืออะไร?
  • POWER BI ตอนที่ 02: พื้นฐาน EXCEL ที่สำคัญก่อนจะเรียนรู้ POWER BI
  • POWER BI ตอนที่ 03: ภาพรวมการใช้งาน POWER BI DESKTOP
  • POWER BI ตอนที่ 04: สร้าง REPORT แรก ใน POWER BI
  • POWER BI ตอนที่ 05: วิธีการ DRILL เพื่อเจาะลึกข้อมูลใน REPORT
  • POWER BI ตอนที่ 06: การปรับแต่งสีใน VISUAL ด้วย CONDITIONAL FORMAT
  • POWER BI ตอนที่ 07: เริ่ม GET DATA ตั้งแต่ไฟล์ยังว่างเปล่า
  • POWER BI ตอนที่ 08: สร้าง DATA MODEL ที่เหมาะสม
  • POWER BI ตอนที่ 09: สร้าง DATE TABLE ด้วย DAX
  • POWER BI ตอนที่ 10: เรียนรู้ DAX เบื้องต้น
  • POWER BI ตอนที่ 11: เรียนรู้ DAX Table Function – FILTER
  • POWER BI ตอนที่ 12: DISTINCT, VALUES, ALL และผองเพื่อน
  • POWER BI ตอนที่ 13: CALCULATE ฟังก์ชันที่ทรงพลังที่สุดใน DAX
  • Power BI ตอนที่ 14: Context Transition และ พลังแฝงใน Measure
  • Power BI ตอนที่ 15: วิธีดึงค่าจาก Slicer มาคำนวณใน Report
  • Power BI ตอนที่ 16 : เดินทางข้ามเวลาไปกับ Time Intelligence DAX Function
  • Power BI ตอนที่ 17 : วิธีทำรายงานเทียบเป้าหมาย Target vs Actual
  • Power BI ตอนที่ 18 : วิธีการกระจายเป้า Allocate Target ด้วย DAX
  • Power BI ตอนที่ 19 : การปรับ Cross Filter Direction เพื่อคำนวณค่าในตาราง Dimension
  • ส่วนเสริม
  • การคำนวณต้นทุนแบบ FIFO ด้วย DAX
  • แสดงข้อมูลสรุปแบบ Top N + Others (ฉบับเทพเอ็กเซล)
  • การวิเคราะห์ Event ที่มีช่วงเวลาเริ่มต้นกับสิ้นสุดคนละวัน
  • เปรียบเทียบ MAX vs LASTDATE ในภาษา DAX

ใครสนใจอยากเรียนเป็นคลิปวีดีโอ ผมมีคอร์สออนไลน์ที่สอน Power BI ตั้งแต่พื้นฐาน สามารถไปดูรายละเอียดได้ที่นี่

This image has an empty alt attribute; its file name is Powerful-Data-Power-BI-1024x538.png
แชร์ความรู้ให้เพื่อนๆ ของคุณ
588    
588    

ติดตามเทพเอ็กเซล

  • Facebook
  • YouTube

อบรมกับเทพเอ็กเซล

🔥 คอร์สใหม่ล่าสุด 🔥

การทำ Optimization ด้วย Excel Solver
สำหรับงานวางแผน
คอร์สออนไลน์ เทพเอ็กเซล
คอร์สออนไลน์ จากเทพเอ็กเซล ดูกี่รอบก็ได้
อบรม Excel / Power BI ให้องค์กรของคุณ

บทความล่าสุด

  • แนวทางฝึกฝน Excel ให้เก่งขึ้น
  • รวม Link เว็บ/เพจเกี่ยวกับ AI
  • วิธีกำหนดท่าทางแบบให้ได้ดั่งใจด้วย ControlNet ใน Stable Diffusion [Part4]
  • วิธีสั่ง Prompt และตั้งค่าใน Stable Diffusion ให้รูปสวยโดนใจ [Part3]
  • วิธีเรียกใช้งาน Model เจ๋งๆ ใน Stable Diffusion [ตอนที่2]
  • วิธีใช้งาน AI สร้างรูปสุดเจ๋งและฟรีด้วย Stable Diffusion ฉบับมือใหม่ [ตอนที่1]
  • 10 ไอเดีย เรียนรู้ Excel ผ่าน ChatGPT AI สุดเจ๋ง

บทความแนะนำ

🔥ฟังก์ชันทั้งหมดใน Excel 🔥

  • แกะเคล็ดวิชา Excel Wizard ในการแข่ง Speed Run Excel ระดับโลก
  • เจาะลึก CALCULATE ใน DAX แบบลึกสุดใจ : Part 1
  • Series สอนดึงข้อมูลจากเว็บ ด้วย Power Automate Desktop
  • สรุปการใช้ LAMBDA ฟังก์ชันที่ใช้สร้างฟังก์ชันใน Excel 365 และผองเพื่อน
  • วิธีใช้ Excel คำนวณระยะเวลาการทำงานรวม แถมระบุเวลาพักได้แบบยืดหยุ่น
  • วิธีจัดการข้อมูลแย่ๆ ด้วย Power Query ทั้งข้อมูลปนกัน ข้อมูลอยู่บนหัวตาราง
  • แยกข้อมูลที่อยู่สุดเน่า ด้วย Excel Power Query

Categories

Tags

ai collection concepts copy database Data Model data validation date dax dropdown error excel filter finance find format formula function game graph IF index intro inventory len link logic lookup match m code merge mid overview paste pivot power query right row solver sort speed split substitute table text time tips trim vba vlookup

Archives

  • April 2023 (3)
  • March 2023 (2)
  • February 2023 (2)
  • January 2023 (1)
  • October 2022 (1)
  • September 2022 (3)
  • August 2022 (3)
  • July 2022 (1)
  • June 2022 (3)
  • May 2022 (1)
  • April 2022 (2)
  • February 2022 (1)
  • December 2021 (2)
  • November 2021 (10)
  • September 2021 (2)
  • August 2021 (6)
  • July 2021 (2)
  • June 2021 (2)
  • May 2021 (10)
  • April 2021 (3)
  • March 2021 (3)
  • February 2021 (4)
  • January 2021 (8)
  • December 2020 (5)
  • November 2020 (13)
  • October 2020 (5)
  • September 2020 (11)
  • August 2020 (4)
  • July 2020 (13)
  • June 2020 (17)
  • May 2020 (16)
  • April 2020 (16)
  • March 2020 (10)
  • February 2020 (15)
  • January 2020 (16)
  • December 2019 (4)
  • November 2019 (3)
  • October 2019 (9)
  • September 2019 (1)
  • August 2019 (7)
  • June 2019 (3)
  • May 2019 (9)
  • April 2019 (9)
  • March 2019 (2)
  • February 2018 (1)
  • January 2018 (3)
  • November 2017 (3)
  • August 2017 (1)
  • July 2017 (1)
  • June 2017 (1)
  • May 2017 (6)
  • April 2017 (6)
  • March 2017 (7)
  • February 2017 (1)
  • January 2017 (2)
  • December 2016 (1)
  • October 2016 (2)
  • September 2016 (3)
  • August 2016 (2)
  • July 2016 (2)
  • June 2016 (1)
  • May 2016 (1)
  • April 2016 (1)
  • March 2016 (2)
  • February 2016 (1)
  • January 2016 (2)
  • December 2015 (2)
  • November 2015 (5)
  • October 2015 (3)
  • June 2015 (2)
  • May 2015 (1)
  • April 2015 (26)
  • January 2015 (1)
  • December 2014 (1)
  • November 2014 (2)
  • October 2014 (1)
  • September 2014 (2)
  • August 2014 (1)
  • June 2014 (1)
  • May 2014 (1)
  • April 2014 (3)
  • March 2014 (3)
  • February 2014 (12)
  • January 2014 (7)
  • December 2013 (2)
  • November 2013 (8)
  • October 2013 (2)

เทพเอ็กเซล : Thep Excel

copyright © 2022

  • Facebook
  • YouTube
เว็บไซต์นี้ใช้คุกกี้ (Cookies)
บริษัท เทพเอ็กเซล จำกัด ให้ความสำคัญต่อข้อมูลส่วนบุคคลของท่าน เพื่อการพัฒนาและปรับปรุงเว็บไซต์รวมถึงสินค้าและบริการต่างๆ หากท่านใช้บริการเว็บไซต์นี้ โดยไม่มีการปรับตั้งค่าใดๆ แสดงว่าท่านยินยอมที่จะรับคุกกี้บนเว็บไซต์ และนโยบายสิทธิส่วนบุคคลของเรา
ตั้งค่าคุกกี้ยอมรับทั้งหมดอ่านเพิ่มเติม
Manage consent

Privacy Overview

This website uses cookies to improve your experience while you navigate through the website. Out of these, the cookies that are categorized as necessary are stored on your browser as they are essential for the working of basic functionalities of the website. We also use third-party cookies that help us analyze and understand how you use this website. These cookies will be stored in your browser only with your consent. You also have the option to opt-out of these cookies. But opting out of some of these cookies may affect your browsing experience.
Necessary
Always Enabled
Necessary cookies are absolutely essential for the website to function properly. These cookies ensure basic functionalities and security features of the website, anonymously.
CookieDurationDescription
cookielawinfo-checkbox-analytics11 monthsThis cookie is set by GDPR Cookie Consent plugin. The cookie is used to store the user consent for the cookies in the category "Analytics".
cookielawinfo-checkbox-functional11 monthsThe cookie is set by GDPR cookie consent to record the user consent for the cookies in the category "Functional".
cookielawinfo-checkbox-necessary11 monthsThis cookie is set by GDPR Cookie Consent plugin. The cookies is used to store the user consent for the cookies in the category "Necessary".
cookielawinfo-checkbox-others11 monthsThis cookie is set by GDPR Cookie Consent plugin. The cookie is used to store the user consent for the cookies in the category "Other.
cookielawinfo-checkbox-performance11 monthsThis cookie is set by GDPR Cookie Consent plugin. The cookie is used to store the user consent for the cookies in the category "Performance".
viewed_cookie_policy11 monthsThe cookie is set by the GDPR Cookie Consent plugin and is used to store whether or not user has consented to the use of cookies. It does not store any personal data.
Functional
Functional cookies help to perform certain functionalities like sharing the content of the website on social media platforms, collect feedbacks, and other third-party features.
Performance
Performance cookies are used to understand and analyze the key performance indexes of the website which helps in delivering a better user experience for the visitors.
Analytics
Analytical cookies are used to understand how visitors interact with the website. These cookies help provide information on metrics the number of visitors, bounce rate, traffic source, etc.
Advertisement
Advertisement cookies are used to provide visitors with relevant ads and marketing campaigns. These cookies track visitors across websites and collect information to provide customized ads.
Others
Other uncategorized cookies are those that are being analyzed and have not been classified into a category as yet.
SAVE & ACCEPT