ThepExcel Logo
  • บทความ
    • Excel
      • Excel ทั่วไป
      • Excel Pivot Table
      • Excel Power Pivot
      • Power Query
      • Excel Array Formula
      • Excel VBA
      • Excel for Business
      • Excel and Maths
      • ฟังก์ชัน Excel ทั้งหมด
    • Power BI
      • Power Query
      • Data Model
      • DAX Formula
      • Power BI Report
    • Coding
      • Excel VBA
      • Python
      • Power Query M Code
    • AI
      • ChatGPT
      • Stable Diffusion
      • MidJourney
    • Highlights : บทความแนะนำ
    • คลิปวีดีโอ
  • อบรม
    • อบรมลูกค้าองค์กร
    • คอร์สออนไลน์ SkillLane
    • แนะนำวิทยากร
    • Excel/Power BI Skill Map
    • Quiz
  • Shop
    • คอร์สออนไลน์
    • สินค้าทั้งหมด
    • หนังสือเล่ม
    • E-Book
    • Cart
  • Download
    • Download ไฟล์จากเทพเอ็กเซล
    • ThepExcel-Mfx : M Code สำเร็จรูป
    • Date Table สำเร็จรูป
    • กราฟ My Skill
    • github.com/ThepExcel
  • รวม Link
    • รวม Link สอน Excel & Power BI ทั้งไทยและเทศ
    • รวม Link เกี่ยวกับ AI
    • รวม Link Coding
    • หนังสือแนะนำ
    • Facebook ThepExcel
    • YouTube ThepExcel
    • DAX Formatter
  • Contact
    • แนะนำ เทพเอ็กเซล (Thep Excel)
    • แนะนำวิทยากร : อาจารย์ ศิระ เอกบุตร (ระ)
    • นโยบายการคุ้มครองข้อมูลส่วนบุคคล (Privacy Policy)
  • Facebook
  • YouTube

บันได 10 ขั้น แห่งการฝึกวิชา DAX

Categories 📂

DAX Formula

Tags 🏷️

dax, overview

ภาษา DAX (Data Analysis eXpression) เป็นภาษาที่ใช้ในการเขียนสูตรของ Power BI และ Power Pivot ซึ่งเป็นภาษาที่มีหน้าตาภายนอกคล้ายคลึงสูตรของ Excel มากๆ แต่เบื้องลึกนั้นอาจมีความต่างพอสมควร…

Concept การทำงานของ DAX นั้นจะผูกโยงกับ Data Model หรือโครงสร้างความสัมพันธ์ของข้อมูลในตาราง และขึ้นอยู่กับบริบทของการ Filter ข้อมูลเป็นอย่างมาก ดังนั้นคนที่ใช้ Excel มาก่อนจำชำนาญแล้ว ก็ยังจำเป็นต้องศึกษา DAX เพิ่มเติมอีกเยอะเลยกว่าจะใช้ได้ DAX ได้เก่ง

จากที่ผมได้เคยอ่านบทความ 10 ขั้นวิทยายุทธ Excel ที่พี่บิว “วิศวกรรีพอร์ต” ได้เขียนไว้นานแล้ว ผมคิดว่ามันทำให้คนอ่านเห็นภาพรวมได้ง่ายขึ้นว่าทักษะ Excel โดยรวมมีอะไร และทักษะตัวเราเองอยู่ประมาณขั้นไหน ผมก็เลยอยากเขียนบทความที่คล้ายๆ กัน แต่เป็นเรื่องของ DAX บ้าง

หวังว่าบทความนี้จะสามารถเป็นเหมือนแผนที่ให้เพื่อนๆ ได้เห็นภาพรวม และเข้าใจการเขียนรู้ DAX ได้มากขึ้นนะครับ ซึ่งแน่นอนว่าการแบ่งขั้นพวกนี้ ไม่ได้มีหลักเกณฑ์สากลอะไรมาแบ่งหรอกครับ แต่เป็นความคิดเห็นของผมที่ใช้ DAX มาเยอะพอสมควร จึงอยากลองเอาความรู้ที่มีมาลองแบ่งดูครับ

ถ้าพร้อมแล้วไปดูกันเลยว่ามีขั้นอะไรบ้าง? แล้วลองอ่านเล่นๆ ดูสิว่าตัวคุณเองน่าจะอยู่ขั้นไหนแล้ว ^^

ขั้นที่ 1 : รู้จักพื้นฐานของ DAX

  • รู้จักประเภทข้อมูลใน DAX
  • รู้ว่า =SUM(TableName[ColumnName]) ควรจะเขียนเป็น New Column หรือ New Measure
  • รู้วิธีอ้างอิงคอลัมน์ (TableName[ColumnName]) อ้างอิงตาราง (TableName) อ้างอิง Measure ([MeasureName])
  • สามารถใช้ฟังก์ชัน DAX ง่ายๆ เช่น SUM, IF, RELATED, DIVIDE, COUNTROWS, DISTINCTCOUNT ได้

ขั้นที่ 2 : เริ่มใช้ลูกเล่นใน DAX

dax
  • สามารถใช้เครื่องหมายพิเศษต่างๆ ในสูตรได้ เช่น เครื่องหมาย &&, ||, IN, NOT, { }
  • รู้ว่า DAX แปลงประเภทข้อมูลให้เราแบบไหน เช่น เอา Text บวกกันได้อะไร?
  • ใช้ SWITCH + TRUE เพื่อเขียนเงื่อนไขแทนการใช้ IF ซ้อน IF
  • สามารถใช้ Iterator เช่น SUMX เพื่อหาผลรวมข้อมูล 2 คอลัมน์ที่คูณกันได้
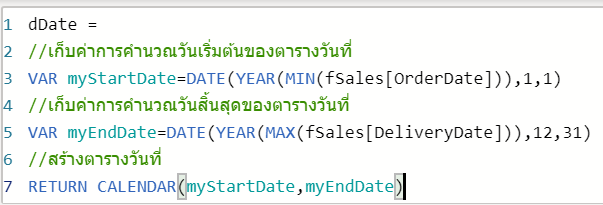
  • ใช้ VAR + RETURN เพื่อประกาศตัวแปรขึ้นมาเก็บการคำนวณในสูตรได้
  • เขียน Comment ในสูตร ( ขึ้นต้นด้วย // ) เพื่ออธิบายการทำงานของสูตรได้
  • สามารถสร้าง Date Table ขึ้นมาได้ด้วยตัวเองด้วย CALENDAR และเพิ่มคอลัมน์ได้ดั่งใจด้วย FORMAT ได้

ขั้นที่ 3 : สามารถใช้ฟังก์ชัน CALCULATE เบื้องต้นได้

  • สามารถรู้ได้ว่า ณ จุดที่เราพิจารณาอยู่นั้น มีการ Filter อะไรอยู่บ้าง (Filter Context)
  • สามารถใช้ CALCULATE Filter ข้อมูล 1 เงื่อนไขเทียบกับค่าคงที่ได้
  • สามารถใช้ CALCULATE Filter ข้อมูล 2 เงื่อนไขแบบ AND ได้
  • รู้ว่าการเขียนเงื่อนไขเปรียบเทียบใน CALCULATE จะปลด Filter เดิมก่อนทำการ Filter เงื่อนไขใหม่
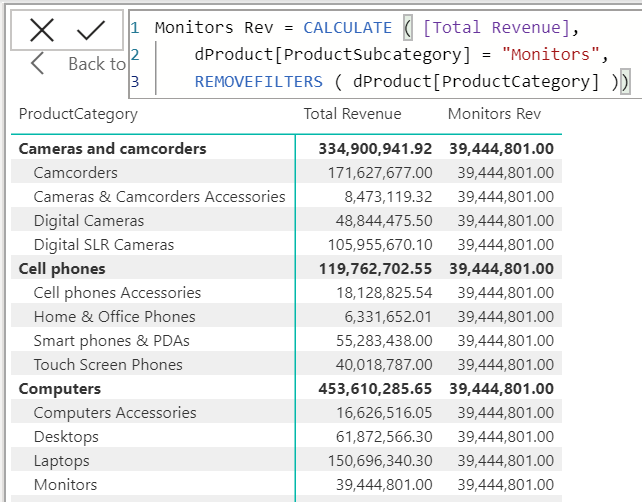
  • สามารถใช้ CALCULATE ปลด Filter ด้วย REMOVEFILTERS, ALL, ALLSELECTED, ALLEXCEPT ได้
เจาะลึก CALCULATE ใน DAX แบบลึกสุดใจ : Part 1

ขั้นที่ 4 : จัดการเงื่อนไขเกี่ยวกับ Filter ที่ระดับต่างๆ ในรายงาน

  • ใช้ฟังก์ชัน FILTER ควบคู่เงื่อนไข AND, OR ได้อย่างเหมาะสม
  • รู้ว่า DAX สามารถมอง Table ที่มี 1 Row 1 Column ให้กลายเป็นค่า Scalar ได้
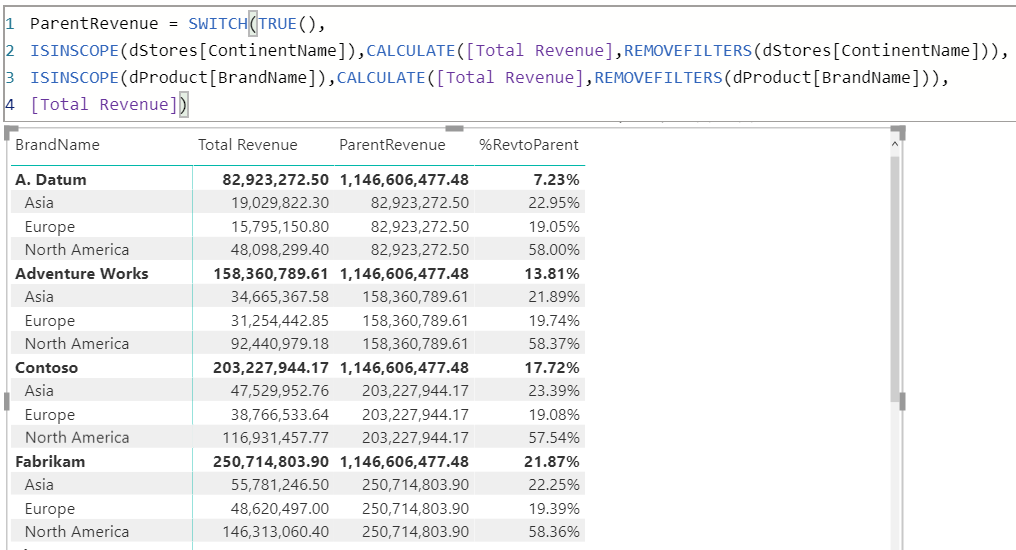
  • ใช้ ISFILTERED, ISCROSSFILTERED, ISINSCOPE แบ่งแยก Level ของ Hierarchy ได้ (เช็คจากตัวย่อยไปใหญ่)
  • ใช้ SELECTEDVALUE เพื่อดึงค่าที่ถูกเลือกจาก Slicer ได้
  • ใช้ TOPN เพื่อคัดเลือกข้อมูลที่ต้องการได้
  • ใช้ LOOKUPVALUE ดึงค่าที่ต้องการตามเงื่อนไขที่กำหนดได้

ขั้นที่ 5 : สามารถใช้ CALCULATE ที่ซับซ้อนขึ้นได้

  • รู้ว่าจริงๆ แล้วเงื่อนไข Filter ของ CALCULATE คือ Table
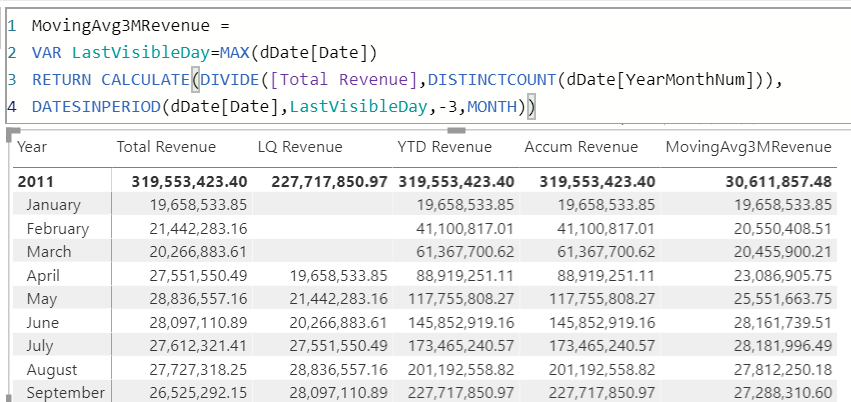
  • สามารถใช้ CALCULATE ควบคู่กับ Time Intelligence Function ได้
  • ใช้ VAR ร่วมกับ CALCULATE เพื่อ Filter ข้อมูลเทียบกับ สูตรหรือ Measure ได้
  • หลังปลด Filter แล้ว ใส่ Filter เข้าไปใหม่เฉพาะ Field ที่ต้องการด้วย VALUES ได้
  • สามารถใช้ CALCULATE จัดการเส้น Relationship ด้วย USERELATIONSHIP/CROSSFILTER ได้
  • รู้จัก Effect ของ Sort by Column ที่มีผลต่อการปลด Filter
  • รู้จัก Effect ของ คอลัมน์ Date ใน Date Table ที่มีผลต่อการปลด Filter

ขั้นที่ 6 : ใช้ Context Transition กับ Iterator ให้เป็นประโยชน์ได้

  • แยกความแตกต่างระหว่าง Row Context และ Filter Context ได้
  • รู้ว่าการอ้าวอิง Measure ทุกครั้งมี CALCULATE แฝงอยู่ และสามารถเกิด Context Transition ได้
  • เข้าใจความแตกต่างของ DISTINCT, VALUES และ ALL และใช้สร้างตารางจำลองใน Measure ได้
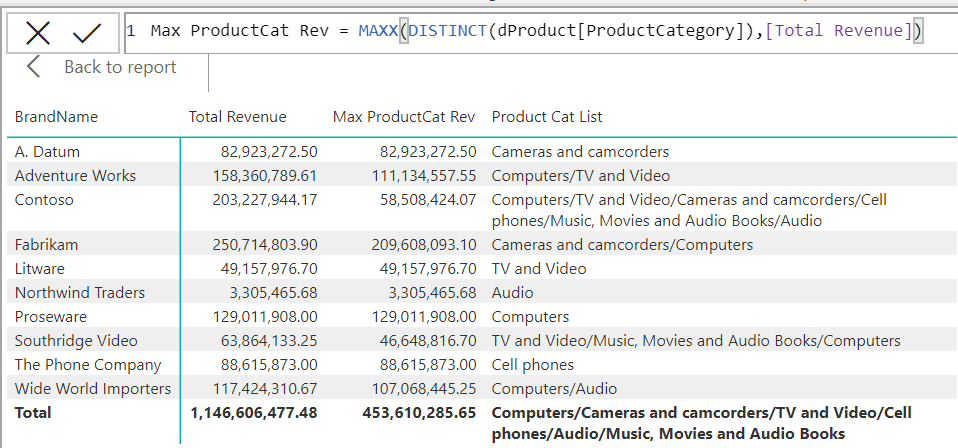
  • สามารถใช้ Context Transition คู่กับ Iterator เช่น SUMX, MAXX, CONCATENATEX, RANKX ได้
  • เข้าใจลำดับขั้นตอนในการคำนวณของ CALCULATE เวลามีหลายเงื่อนไขพร้อมกัน รวมถึงเวลาใช้ CALCULATE 2 ตัวซ้อนกัน

ขั้นที่ 7 : ใช้ Expanded Table ให้เป็น

  • เข้าใจแนวคิดของ Expanded Table ว่ามันคือตารางหลัก + ดึงคอลัมน์ที่เกี่ยวข้องทั้งหมดจากตารางฝั่งที่เป็นเลข 1
  • เข้าใจว่าจริงๆ แล้วการทำงานของ RELATED นั้นเป็นการเข้าถึง Column ใน Expanded Table
  • รู้ว่าการอ้างอิง Table หมายถึง Expanded Table เสมอ
  • เข้าใจความแตกต่างของ Column Filter และ Table Filter (Expanded Table) และเลือกใช้ให้ถูกต้อง
  • สามารถใช้ Expanded Table เป็นเงื่อนไขของ CALCULATE ได้อย่างเหมาะสม

ขั้นที่ 8 : รู้จักสร้าง/จัดการตารางจำลอง

  • สามารถสร้างคอลัมน์จำลองในตารางจำลองด้วย ADDCOLUMNS และเลือกคอลัมน์ด้วย SELECTCOLUMNS
  • รู้ว่าสามารถอ้างอิงคอลัมน์ในตารางจำลองที่สร้างขึ้นใน VAR ด้วย [ColumnName] ได้
  • เลือกใช้ CALCULATETABLE (มี Context Transition) แทน Filter ได้อย่างเหมาะสม
  • ใช้ UNION, INTERSECT และ EXCEPT เพื่อสร้างตารางผลลัพธ์ใหม่ที่ต้องการ
  • เข้าใจความแตกต่างของ SUMMARIZE , GROUPBY, CROSSJOIN, GENERATE, GENERATESERIES
  • รู้จักแนวคิดของ Data Lineage
  • สามารถใช้ TREATAS ใน CALCULATE เพื่อเลียนแบบ Relationship จากคอลัมน์อื่น / สร้าง Virtual Relationship ได้
  • สามารถใช้ INTERSECT แทน TREATAS ได้กรณีที่ไม่มีให้ใช้ (เช่น ใน Excel)

ขั้นที่ 9 : เข้าใจ/สร้างสูตร DAX ที่ซับซ้อนได้

  • เข้าใจ DAX Pattern ต่างๆ ใน DaxPatterns.com ได้
  • สามารถสร้างสูตร DAX เพื่อตอบโจทย์ธุรกิจที่ต้องการได้ เช่น คำนวณสินค้าคงค้างเฉลี่ย, คำนวณต้นทุน FIFO, คำนวณยอดเงิน Balance ล่าสุดในบัญชี เป็นต้น
  • จัดการปัญหาใน Data Model ที่มีความสัมพันธ์แบบ Many to Many ได้
  • สามารถใช้ Calculation Group ได้
  • เข้าใจการทำงานที่แท้จริงของ ALLSELECTED (เกี่ยวกับ Shadow Filter Context)

ขั้นที่ 10 : Optimize การทำงานของ DAX ให้เร็วขึ้น

  • สามารถใช้ DAX Studio เพื่อสร้าง/ทดสอบ DAX Query ได้
  • เข้าใจการทำงานของ DAX Engine ทั้งส่วนของ Formula Engine และ Storage Engine
  • เข้าใจการทำงานของ Vertipaq Storage Engine
  • ใช้ Vertipaq Analyzer เพื่อดูข้อมูลเกี่ยวกับสูตรต่างๆ และ Data Model ได้
  • สามารถค้นหา DAX/MDX Query ที่เป็นตัวปัญหาที่ทำให้รายงานช้าได้
  • สามารถตัดสินใจว่าเมื่อไหร่ควรจะสร้าง New Column ขึ้นมาจริงๆ เพื่อให้เกิด Performance ที่ดีที่สุด
  • สามารถวิเคราะห์ DAX Query Plan และ Server Timing เพื่อหาตัว Bottlenecks หรือคอขวดได้
  • เลือกใช้ฟังก์ชันและวิธีที่เหมาะสมในการแก้ปัญหาแทนวิธีการเดิมที่เชื่องช้าได้

คุณล่ะ คิดว่าตัวเองอยู่ประมาณขั้นไหน?

https://pixabay.com/photos/forest-glade-enlightenment-mystical-4571929/

ถ้าจะให้ลองประเมินตัวเองเล่นๆ ตอนนี้ผมเองก็น่าจะอยู่ขั้น 8-9 เท่านั้นครับ (ยังไม่ถึง 10 แน่นอน) ดังนั้นเป็นไปได้ว่า อาจจะยังมีสิ่งที่ยากกว่าขั้นที่ 10 อีกแต่ผมยังไม่รู้ ดังนั้นหากใครที่มีความเชี่ยวชาญ DAX อยากจะเสนอแนะอะไรก็สามารถบอกได้เลยไม่ต้องเกรงใจนะครับ

ป.ล. 10 ขั้นที่เขียนนี้พูดแค่เรื่องในมิติของ DAX เท่านั้นนะครับ ซึ่งไม่ได้รวมถึงเรื่องสำคัญอื่นๆ ใน Power BI เช่น Power Query / Data Model / ส่วน Report Visualization นะครับ ซึ่งยังต้องเก่งเรื่องพวกนี้อีกถึงจะใช้ Power BI ได้เต็มที เฮ้อ…เหนื่อย! (แต่มันคุ้มนะ เพราะมันเจ๋งมากจริงๆ)

ส่วนตัวผมเองคิดว่าจะนำลำดับขั้นเหล่านี้ไปปรับปรุงคอร์ส Power BI ของผมให้ดียิ่งขึ้นด้วยครับ และน่าจะเป็นแนวทางที่ดีในการพัฒนาคอร์ส DAX Advance ในอนาคตด้วยครับ ^^

แชร์ความรู้ให้เพื่อนๆ ของคุณ
7    
7    

ติดตามเทพเอ็กเซล

  • Facebook
  • YouTube

อบรมกับเทพเอ็กเซล

🔥 คอร์สใหม่ล่าสุด 🔥

การทำ Optimization ด้วย Excel Solver
สำหรับงานวางแผน
คอร์สออนไลน์ เทพเอ็กเซล
คอร์สออนไลน์ จากเทพเอ็กเซล ดูกี่รอบก็ได้
อบรม Excel / Power BI ให้องค์กรของคุณ

บทความล่าสุด

  • วิธีผสม Model สูตรผสมแบบโดนใจใน Stable Diffusion [Part7]
  • สอนทำรูปตัวเองคู่กับสาว ใน Stable Diffusion [Part6]
  • สอน Train Model ตัวเองใน Stable Diffusion [Part5]
  • 10 Levels การเขียนสูตร Excel ในยุคใหม่
  • บันได 10 ขั้น เริ่มเรียนรู้ M Code ขุมพลังของ Power Query
  • แนวทางฝึกฝน Excel ให้เก่งขึ้น
  • รวม Link เว็บ/เพจเกี่ยวกับ AI

บทความแนะนำ

🔥ฟังก์ชันทั้งหมดใน Excel 🔥

  • 10 Levels การเขียนสูตร Excel ในยุคใหม่
  • แกะเคล็ดวิชา Excel Wizard ในการแข่ง Speed Run Excel ระดับโลก
  • เจาะลึก CALCULATE ใน DAX แบบลึกสุดใจ : Part 1
  • Series สอนดึงข้อมูลจากเว็บ ด้วย Power Automate Desktop
  • สรุปการใช้ LAMBDA ฟังก์ชันที่ใช้สร้างฟังก์ชันใน Excel 365 และผองเพื่อน
  • วิธีใช้ Excel คำนวณระยะเวลาการทำงานรวม แถมระบุเวลาพักได้แบบยืดหยุ่น
  • วิธีจัดการข้อมูลแย่ๆ ด้วย Power Query ทั้งข้อมูลปนกัน ข้อมูลอยู่บนหัวตาราง

Categories

Tags

ai collection concepts copy database Data Model data validation date dax dropdown error excel filter finance find format formula function game graph IF index intro len link logic lookup match matrix mcode m code merge mid overview paste pivot power query row sort speed split stable diffusion substitute table text time tips trim vba vlookup

Archives

  • April 2023 (8)
  • March 2023 (2)
  • February 2023 (2)
  • January 2023 (1)
  • October 2022 (1)
  • September 2022 (3)
  • August 2022 (3)
  • July 2022 (1)
  • June 2022 (3)
  • May 2022 (1)
  • April 2022 (2)
  • February 2022 (1)
  • December 2021 (2)
  • November 2021 (10)
  • September 2021 (2)
  • August 2021 (6)
  • July 2021 (2)
  • June 2021 (2)
  • May 2021 (10)
  • April 2021 (3)
  • March 2021 (3)
  • February 2021 (4)
  • January 2021 (8)
  • December 2020 (5)
  • November 2020 (13)
  • October 2020 (5)
  • September 2020 (11)
  • August 2020 (4)
  • July 2020 (13)
  • June 2020 (17)
  • May 2020 (16)
  • April 2020 (16)
  • March 2020 (10)
  • February 2020 (15)
  • January 2020 (16)
  • December 2019 (4)
  • November 2019 (3)
  • October 2019 (9)
  • September 2019 (1)
  • August 2019 (7)
  • June 2019 (3)
  • May 2019 (9)
  • April 2019 (9)
  • March 2019 (2)
  • February 2018 (1)
  • January 2018 (3)
  • November 2017 (3)
  • August 2017 (1)
  • July 2017 (1)
  • June 2017 (1)
  • May 2017 (6)
  • April 2017 (6)
  • March 2017 (7)
  • February 2017 (1)
  • January 2017 (2)
  • December 2016 (1)
  • October 2016 (2)
  • September 2016 (3)
  • August 2016 (2)
  • July 2016 (2)
  • June 2016 (1)
  • May 2016 (1)
  • April 2016 (1)
  • March 2016 (2)
  • February 2016 (1)
  • January 2016 (2)
  • December 2015 (2)
  • November 2015 (5)
  • October 2015 (3)
  • June 2015 (2)
  • May 2015 (1)
  • April 2015 (26)
  • January 2015 (1)
  • December 2014 (1)
  • November 2014 (2)
  • October 2014 (1)
  • September 2014 (2)
  • August 2014 (1)
  • June 2014 (1)
  • May 2014 (1)
  • April 2014 (3)
  • March 2014 (3)
  • February 2014 (12)
  • January 2014 (7)
  • December 2013 (2)
  • November 2013 (8)
  • October 2013 (2)

เทพเอ็กเซล : Thep Excel

copyright © 2022

  • Facebook
  • YouTube
เว็บไซต์นี้ใช้คุกกี้ (Cookies)
บริษัท เทพเอ็กเซล จำกัด ให้ความสำคัญต่อข้อมูลส่วนบุคคลของท่าน เพื่อการพัฒนาและปรับปรุงเว็บไซต์รวมถึงสินค้าและบริการต่างๆ หากท่านใช้บริการเว็บไซต์นี้ โดยไม่มีการปรับตั้งค่าใดๆ แสดงว่าท่านยินยอมที่จะรับคุกกี้บนเว็บไซต์ และนโยบายสิทธิส่วนบุคคลของเรา
ตั้งค่าคุกกี้ยอมรับทั้งหมดอ่านเพิ่มเติม
Manage consent

Privacy Overview

This website uses cookies to improve your experience while you navigate through the website. Out of these, the cookies that are categorized as necessary are stored on your browser as they are essential for the working of basic functionalities of the website. We also use third-party cookies that help us analyze and understand how you use this website. These cookies will be stored in your browser only with your consent. You also have the option to opt-out of these cookies. But opting out of some of these cookies may affect your browsing experience.
Necessary
Always Enabled
Necessary cookies are absolutely essential for the website to function properly. These cookies ensure basic functionalities and security features of the website, anonymously.
CookieDurationDescription
cookielawinfo-checkbox-analytics11 monthsThis cookie is set by GDPR Cookie Consent plugin. The cookie is used to store the user consent for the cookies in the category "Analytics".
cookielawinfo-checkbox-functional11 monthsThe cookie is set by GDPR cookie consent to record the user consent for the cookies in the category "Functional".
cookielawinfo-checkbox-necessary11 monthsThis cookie is set by GDPR Cookie Consent plugin. The cookies is used to store the user consent for the cookies in the category "Necessary".
cookielawinfo-checkbox-others11 monthsThis cookie is set by GDPR Cookie Consent plugin. The cookie is used to store the user consent for the cookies in the category "Other.
cookielawinfo-checkbox-performance11 monthsThis cookie is set by GDPR Cookie Consent plugin. The cookie is used to store the user consent for the cookies in the category "Performance".
viewed_cookie_policy11 monthsThe cookie is set by the GDPR Cookie Consent plugin and is used to store whether or not user has consented to the use of cookies. It does not store any personal data.
Functional
Functional cookies help to perform certain functionalities like sharing the content of the website on social media platforms, collect feedbacks, and other third-party features.
Performance
Performance cookies are used to understand and analyze the key performance indexes of the website which helps in delivering a better user experience for the visitors.
Analytics
Analytical cookies are used to understand how visitors interact with the website. These cookies help provide information on metrics the number of visitors, bounce rate, traffic source, etc.
Advertisement
Advertisement cookies are used to provide visitors with relevant ads and marketing campaigns. These cookies track visitors across websites and collect information to provide customized ads.
Others
Other uncategorized cookies are those that are being analyzed and have not been classified into a category as yet.
SAVE & ACCEPT