ThepExcel Logo
  • บทความ
    • Excel
      • Excel ทั่วไป
      • Excel Pivot Table
      • Excel Power Pivot
      • Power Query
      • Excel Array Formula
      • Excel VBA
      • Excel for Business
      • Excel and Maths
      • ฟังก์ชัน Excel ทั้งหมด
    • Power BI
      • Power Query
      • Data Model
      • DAX Formula
      • Power BI Report
    • Coding
      • Excel VBA
      • Python
      • Power Query M Code
    • AI
      • ChatGPT
      • Stable Diffusion
      • MidJourney
    • Highlights : บทความแนะนำ
    • คลิปวีดีโอ
  • อบรม
    • อบรมลูกค้าองค์กร
    • คอร์สออนไลน์ SkillLane
    • แนะนำวิทยากร
    • Excel/Power BI Skill Map
    • Quiz
  • Shop
    • คอร์สออนไลน์
    • สินค้าทั้งหมด
    • หนังสือเล่ม
    • E-Book
    • Cart
  • Download
    • Download ไฟล์จากเทพเอ็กเซล
    • ThepExcel-Mfx : M Code สำเร็จรูป
    • Date Table สำเร็จรูป
    • กราฟ My Skill
    • github.com/ThepExcel
  • รวม Link
    • รวม Link สอน Excel & Power BI ทั้งไทยและเทศ
    • รวม Link สอน Python / Programming
    • หนังสือแนะนำ
    • Facebook ThepExcel
    • YouTube ThepExcel
    • DAX Formatter
  • Contact
    • แนะนำ เทพเอ็กเซล (Thep Excel)
    • แนะนำวิทยากร : อาจารย์ ศิระ เอกบุตร (ระ)
    • นโยบายการคุ้มครองข้อมูลส่วนบุคคล (Privacy Policy)
  • Facebook
  • YouTube

สอนทำ Simulation ใน Excel เพื่อประมาณค่า Pi

Categories 📂

Excel and Maths, Solver & Simulation

Tags 🏷️

data table, pi, simulation

เพื่อนๆ รู้จักค่า Pi มาบ้างใช่มั้ยครับ? (ไอ้เลข 3.14159… นั่นแหละ)

ในบทความนี้เราจะลองสมมติว่าเราไม่เคยรู้มาก่อนเลยว่าค่า Pi คือเลขอะไร แต่เราดันอยากจะลองประมาณค่า Pi ขึ้นมาด้วยความรู้ทางคณิตศาสตร์พื้นฐาน เช่น ระยะทางระหว่างจุด (ซึ่งก็คือเรื่องเดียวกับสามเหลี่ยมมุมฉากนั่นแหละ)
หากถามว่าจะทำไปเพื่ออะไร! ในเมื่อแค่ใช้ฟังก์ชัน PI() ก็ได้ผลลัพธ์แล้ว ?

ก็ต้องบอกว่าทำเพื่อความสนุกแบบ Nerd ล้วนๆ และเพื่อหัดทำ Simulation ใน Excel ครับ เพราะการทำ Simulation เป็นจะช่วยให้เราเข้าใจอะไรหลายๆ อย่างได้ดีขึ้น เช่น อาาจไปใช้ทดสอบการลงทุนหุ้นอะไรแบบนี้ก็ได้ครับ

สารบัญ

  • ทฤษฎีที่ควรรู้
  • วิธีแรก : Copy สูตรไปหลายๆ ช่องเลย
  • วิธีที่ 2 : ใช้ Data Table
  • สรุป

ทฤษฎีที่ควรรู้

ถ้าใครสังเกตจะพบว่าค่า Pi นั้นมีความเกี่ยวข้องกับรูปวงกลมอยู่อย่างมากเลย ตอนที่พวกเราเรียนวิชาคณิตศาสตร์สมัยเด็กๆ ก็ทำให้เรารู้ว่า พื้นที่ของวงกลมคำนวณได้ดังนี้

Area = \pi r^2

ความน่าสนใจคือ ถ้าเราลองสมมติให้รัศมีของวงกลมมีค่าเป็น 1 หน่วย แบบนี้วงกลมก็จะมีพื้นที่เท่ากับค่า Pi ตารางหน่วย พอดีเลยจริงมั้ยครับ?

Area วงกลมรัศมี 1 หน่วย= \pi *1*1

ทีนี้ถ้าเราเอาวงกลมรัศมี 1 หน่วย ไปยัดลงในสี่เหลี่ยมจตุรัสแบบพอดีๆ เราจะพบว่า สี่เหลี่ยมนั้นจะมีพื้นที่ =2*2 = 4 ตารางหน่วย ดังรูปข้างล่างจริงมั้ยครับ? (ตอนวาดรูปนี้ใช้ Shape -> Align -> Snap to Grid เพื่อให้วาดได้เป๊ะครับ)

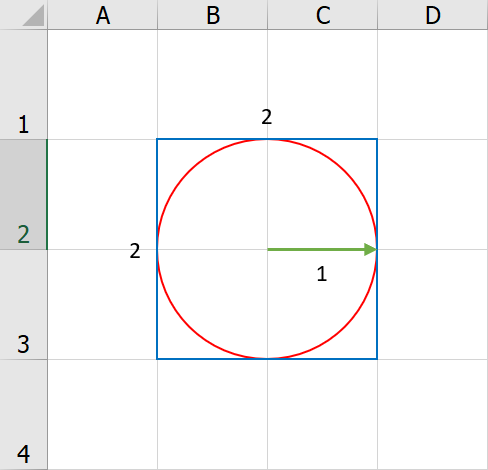
ดังนั้นถ้าถามว่า “อัตราส่วน” ของพื้นที่วงกลมต่อพื้นที่สี่เหลี่ยมเป็นเท่าไหร่? มันก็คือ แบบนี้

\dfrac{พื้นที่วงกลม}{พื้นที่สี่เหลี่ยม} = \dfrac{\pi}{4}

ถ้าความสัมพันธ์เป็นแบบนี้ หากเราลอง “สุ่ม” จุดลงไปในพื้นที่สี่เหลี่ยม แบบเยอะๆ รัวๆ เลย มันก็น่าจะเข้าส่วนที่เป็นวงกลมในอัตราส่วน Pi/4 % นั่นเอง

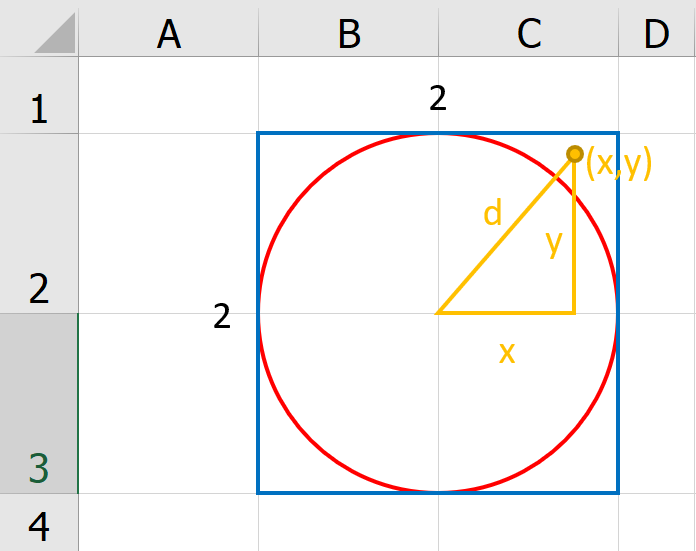
วิธีการคือ เราจะสุ่มค่า x และ y ตั้งแต่ -1 จนถึง 1 แล้วดูว่ามันอยู่ในวงกลมหรือไม่? โดยใช้ความรู้เรื่องระยะทางระหว่างจุดมาช่วยครับ

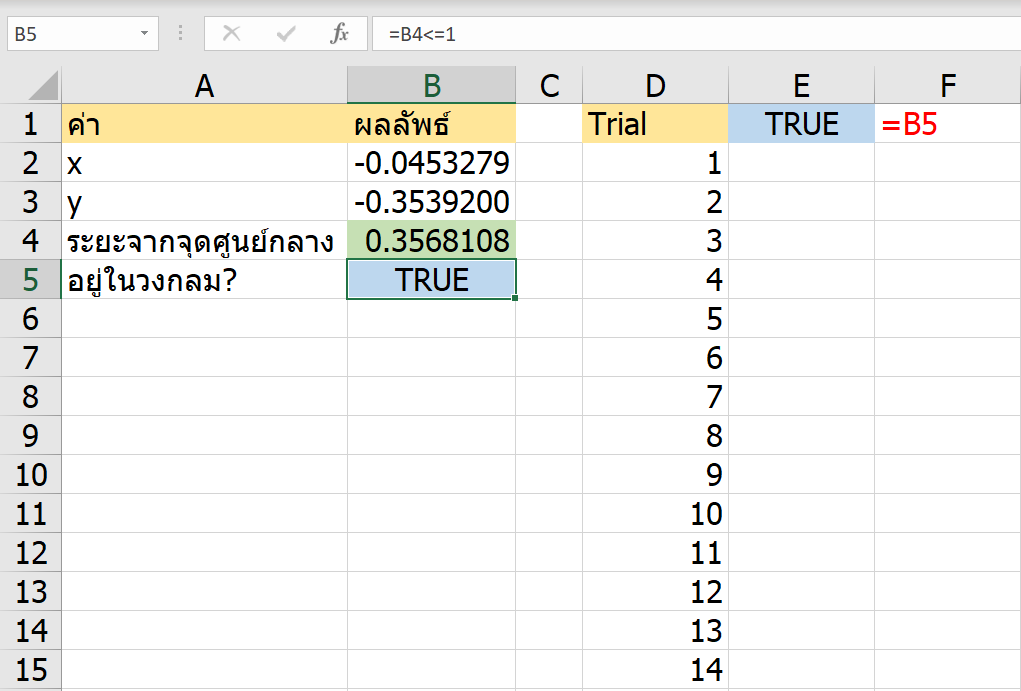
เช่น พอเราสุ่มค่ามาแล้วได้ค่า x กับค่า y มา เราจะหาว่ามันห่างจากจุด 0,0 เท่าไหร่ (ให้เป็นระยะ d) มันก็คือการคำนวณจากระยะด้านตรงข้ามมุมฉากของรูปสามเหลี่ยมนั่นเอง

ระยะ d = \sqrt(x^2+y^2)

งั้นเราลอง Random ค่า x กับ y ระหว่าง -1 ถึง 1 แล้วหาค่า d กันครับ ถ้ามันไม่เกิน 1 แสดงว่ายังอยู่ในวงกลมนั่นเองครับ

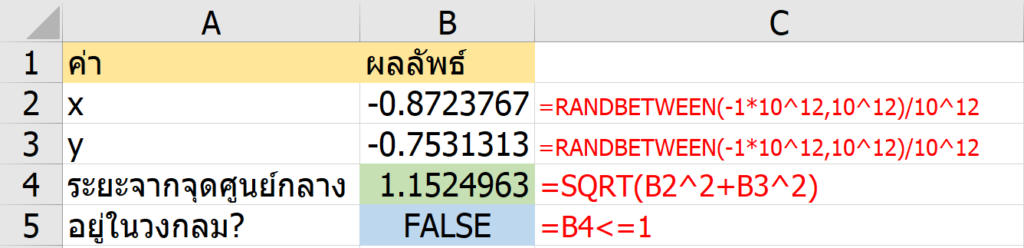
และนี่คือตัวอย่างของการ Random 1 ครั้งครับ

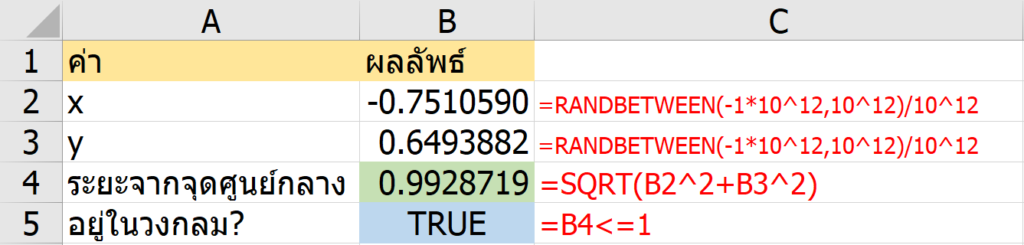
ถ้าเรามีการให้ Excel คำนวณใหม่ หรือกด F9 เพื่อให้ Recal ค่าที่ได้ก็อาจจะเปลี่ยนไป

ซึ่งถ้าเราสุ่มจำนวนครั้งมากพอ แล้วหาอัตราส่วนว่ามันอยู่ในวงกลมกี่ % เราก็จะหาค่า Pi ได้ในที่สุดครับ ซึ่งการทำ Simulation จากการสุ่มมีชื่อเรียกว่า Monte Carlo Simulation นั่นเองครับ

และถ้าย้ายข้างหาค่า Pi ก็จะได้ดังนี้

\pi=\dfrac{จำนวนที่สุ่มลงวงกลม}{จำนวนที่สุ่มลงสี่เหลี่ยม} *4

แล้วเราจะสุ่มค่าจำนวนหลายๆ ครั้งแล้วบันทึกค่าไว้ได้ยังไง? เพราะถ้าเรากด F9 ทุกอย่างก็จะเปลี่ยนไปหมดเลย…

วิธีการทำ Simulation นั้นมีอยู่ 2 วิธีครับ

วิธีแรก : Copy สูตรไปหลายๆ ช่องเลย

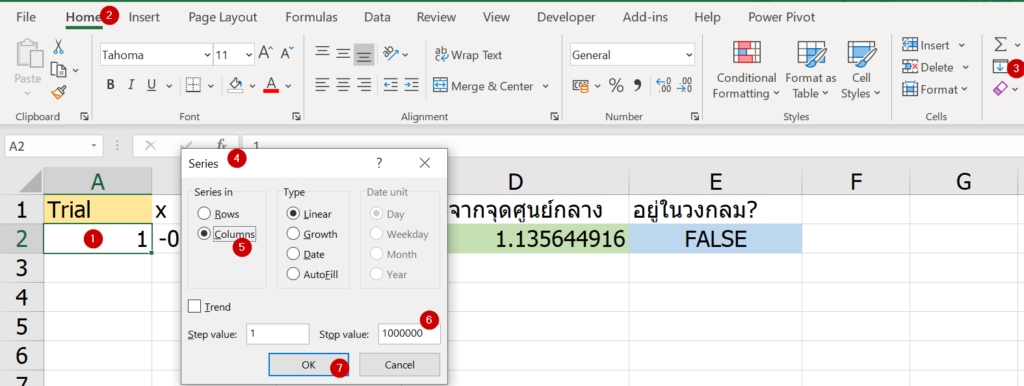
วิธีการแรก คือ การทำแบบตรงไปตรงมาสุดๆ นั่นคือ ให้ Copy สูตรให้ครบจำนวนเยอะๆ ตามที่ต้องการ (เช่น พัน, หมื่น, แสน, ล้านครั้ง ยิ่งเยอะยิ่งแม่น) ซึ่งถ้าเราต้องการ 1 ล้านครั้ง ก็ให้ Copy สูตรลงไปล้านบรรทัด ซึ่งเราใช้ Fill Series มาช่วยสร้างค่า 1 ล้านค่าได้โดยไม่ต้องลากลงไปเอง ดังนี้

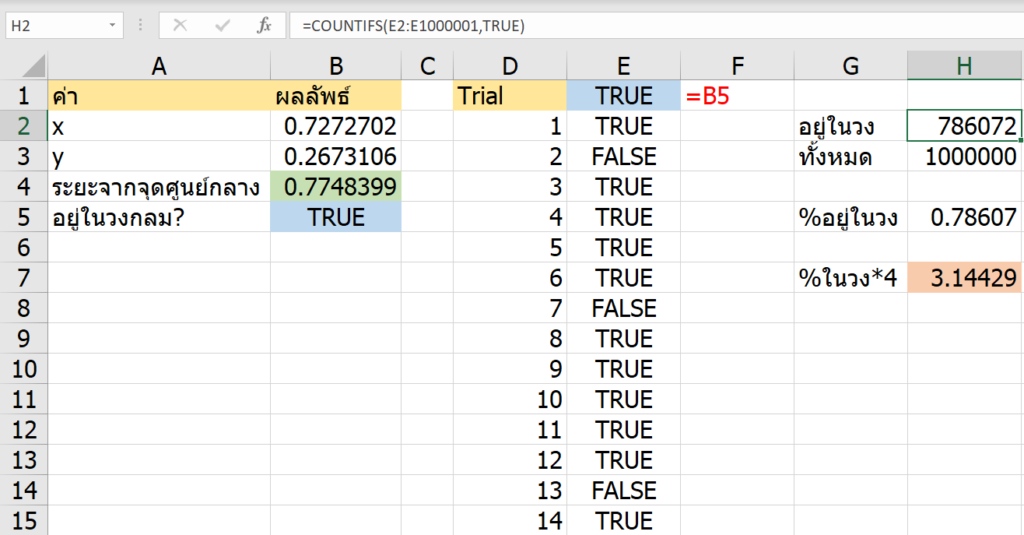
จากนั้นก็ Copy สูตรลงไป (จุดนี้ระวังเครื่องแฮงค์…) แล้วนับว่ามี TRUE กี่อัน จากจำนวนการทดลอง 1 ล้านครั้ง

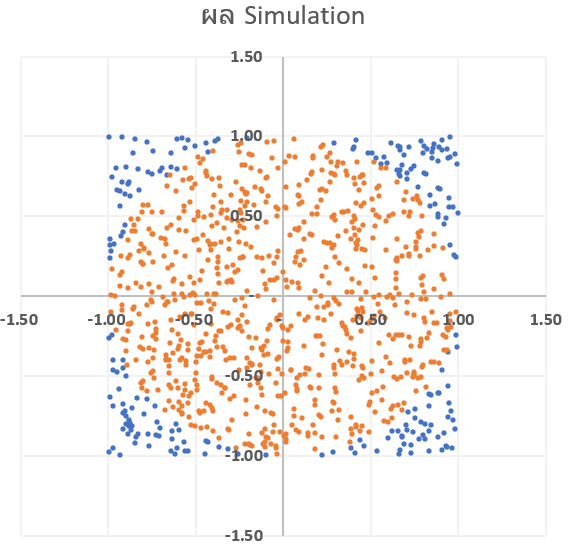
ถ้าลอง Plot กราฟ จะได้ประมาณนี้ (แต่กราฟนี้ผมเอาแค่ 1000 จุด)

พอเรา เอาอัตราส่วนดังกล่าวไป*4 ก็จะได้ค่า Pi ที่เราประมาณค่าขึ้นมาได้นั่นเอง ซึ่งจะพบว่าก็ใกล้เคียงกับค่า 3.14159 ที่เราเรียนมาพอสมควรครับ (ยิ่งสุ่มเยอะ ยิ่งแม่น)

วิธีที่ 2 : ใช้ Data Table

ถ้าเราไม่อยาก Copy สูตรลงมาเยอะๆ เรายังสามารถทำอีกวิธีได้คือใช้เครื่องมือ Data Table ใน What-if Analysis มาช่วยครับ (ใครยังไม่เคยใช้ Data Table ลองอ่านบทความนี้ก่อนได้)

ก่อนอื่นก็ให้เตรียมพื้นที่ที่จะแสดงผลลัพธ์ทั้ง 1 ล้านครั้งซะก่อนดังรูป โดยที่ Cell ด้านบนที่เป็นหัวของผลลัพธ์ 1 ล้านครั้งนั้น ให้ Link ค่ากับ Cell ที่ต้องการแสดงออกมา ซึ่งก็คือเขียนว่า =B5 ดังรูป

จากนั้นให้เลือกคลุมข้อมูล D1:E1000001 แล้วเลือก Data -> What if Analysis -> Data Table…

ซึ่ง Trick คือให้เลือก Column Input Cell เป็นช่องอะไรก็ได้ที่ไม่เกี่ยวกับสูตรเลย (ทั้งนี้เพื่อให้ไม่ต้องเกิดการเอาค่า 1,2,3,4 ไปใส่ในสูตรจริงๆ เพราะมันไม่เกี่ยวกัน)

พอกด Ok เราก็จะได้ผลลัพธ์ 1 ล้านครั้ง (จุดนี้ระวังเครื่องแฮงค์…) และสามารถหาค่าประมาณการของค่า Pi ได้เช่นเดิมครับ วิธีนี้จะเห็นแค่ผลลัพธ์จำนวน 1 ล้านครั้ง โดยไม่ต้องมี input ตัวอื่นโผล่มาให้เกะกะเลย

สรุป

เวลาเราทำการ Random สุ่มค่าจำนวนครั้งเยอะๆ นอกจากจะใช้การ Copy Paste ออกมาจำนวนมากแล้ว เรายังสามารถใช้ Data Table มาช่วยในการสร้างผลลัพธ์หลายๆ ค่าได้ด้วยครับ

แม้ว่าการทำใน Excel จะค่อนข้างช้าเมื่อเทียบกับการใช้เครื่องมือเขียนโปรแกรมอย่าง R, Python แต่ว่าก็ยังเป็นวิธีที่สะดวกสำหรับคนทั่วไปที่เขียนโปรแกรมไม่เป็นอยู่ครับผม

แชร์ความรู้ให้เพื่อนๆ ของคุณ


ติดตามเทพเอ็กเซล

  • Facebook
  • YouTube

อบรมกับเทพเอ็กเซล

🔥 คอร์สใหม่ล่าสุด 🔥

การทำ Optimization ด้วย Excel Solver
สำหรับงานวางแผน
คอร์สออนไลน์ เทพเอ็กเซล
คอร์สออนไลน์ จากเทพเอ็กเซล ดูกี่รอบก็ได้
อบรม Excel / Power BI ให้องค์กรของคุณ

บทความล่าสุด

  • วิธีสั่ง Prompt และตั้งค่าใน Stable Diffusion ให้รูปสวยโดนใจ [Part3]
  • วิธีเรียกใช้งาน Model เจ๋งๆ ใน Stable Diffusion [ตอนที่2]
  • วิธีใช้งาน AI สร้างรูปสุดเจ๋งและฟรีด้วย Stable Diffusion ฉบับมือใหม่ [ตอนที่1]
  • 10 ไอเดีย เรียนรู้ Excel ผ่าน ChatGPT AI สุดเจ๋ง
  • การทำ Simulation ด้วย Excel
  • แกะเคล็ดวิชา Excel Wizard ในการแข่ง Speed Run Excel ระดับโลก
  • เจาะลึก CALCULATE ใน DAX แบบลึกสุดใจ : Part 2

บทความแนะนำ

🔥ฟังก์ชันทั้งหมดใน Excel 🔥

  • แกะเคล็ดวิชา Excel Wizard ในการแข่ง Speed Run Excel ระดับโลก
  • เจาะลึก CALCULATE ใน DAX แบบลึกสุดใจ : Part 1
  • Series สอนดึงข้อมูลจากเว็บ ด้วย Power Automate Desktop
  • สรุปการใช้ LAMBDA ฟังก์ชันที่ใช้สร้างฟังก์ชันใน Excel 365 และผองเพื่อน
  • วิธีใช้ Excel คำนวณระยะเวลาการทำงานรวม แถมระบุเวลาพักได้แบบยืดหยุ่น
  • วิธีจัดการข้อมูลแย่ๆ ด้วย Power Query ทั้งข้อมูลปนกัน ข้อมูลอยู่บนหัวตาราง
  • แยกข้อมูลที่อยู่สุดเน่า ด้วย Excel Power Query

Categories

Tags

ai collection concepts copy database Data Model data table data validation date dax dropdown error excel filter finance find format formula function game graph IF index intro irr len link logic lookup match m code merge mid overview paste pivot power query row sort speed split substitute table text textjoin time tips trim vba vlookup

Archives

  • March 2023 (2)
  • February 2023 (2)
  • January 2023 (1)
  • October 2022 (1)
  • September 2022 (3)
  • August 2022 (3)
  • July 2022 (1)
  • June 2022 (3)
  • May 2022 (1)
  • April 2022 (2)
  • February 2022 (1)
  • December 2021 (2)
  • November 2021 (10)
  • September 2021 (2)
  • August 2021 (6)
  • July 2021 (2)
  • June 2021 (2)
  • May 2021 (10)
  • April 2021 (3)
  • March 2021 (3)
  • February 2021 (4)
  • January 2021 (8)
  • December 2020 (5)
  • November 2020 (13)
  • October 2020 (5)
  • September 2020 (11)
  • August 2020 (4)
  • July 2020 (13)
  • June 2020 (17)
  • May 2020 (16)
  • April 2020 (16)
  • March 2020 (10)
  • February 2020 (15)
  • January 2020 (16)
  • December 2019 (4)
  • November 2019 (3)
  • October 2019 (9)
  • September 2019 (1)
  • August 2019 (7)
  • June 2019 (3)
  • May 2019 (9)
  • April 2019 (9)
  • March 2019 (2)
  • February 2018 (1)
  • January 2018 (3)
  • November 2017 (3)
  • August 2017 (1)
  • July 2017 (1)
  • June 2017 (1)
  • May 2017 (6)
  • April 2017 (6)
  • March 2017 (7)
  • February 2017 (1)
  • January 2017 (2)
  • December 2016 (1)
  • October 2016 (2)
  • September 2016 (3)
  • August 2016 (2)
  • July 2016 (2)
  • June 2016 (1)
  • May 2016 (1)
  • April 2016 (1)
  • March 2016 (2)
  • February 2016 (1)
  • January 2016 (2)
  • December 2015 (2)
  • November 2015 (5)
  • October 2015 (3)
  • June 2015 (2)
  • May 2015 (1)
  • April 2015 (26)
  • January 2015 (1)
  • December 2014 (1)
  • November 2014 (2)
  • October 2014 (1)
  • September 2014 (2)
  • August 2014 (1)
  • June 2014 (1)
  • May 2014 (1)
  • April 2014 (3)
  • March 2014 (3)
  • February 2014 (12)
  • January 2014 (7)
  • December 2013 (2)
  • November 2013 (8)
  • October 2013 (2)

เทพเอ็กเซล : Thep Excel

copyright © 2022

  • Facebook
  • YouTube
เว็บไซต์นี้ใช้คุกกี้ (Cookies)
บริษัท เทพเอ็กเซล จำกัด ให้ความสำคัญต่อข้อมูลส่วนบุคคลของท่าน เพื่อการพัฒนาและปรับปรุงเว็บไซต์รวมถึงสินค้าและบริการต่างๆ หากท่านใช้บริการเว็บไซต์นี้ โดยไม่มีการปรับตั้งค่าใดๆ แสดงว่าท่านยินยอมที่จะรับคุกกี้บนเว็บไซต์ และนโยบายสิทธิส่วนบุคคลของเรา
ตั้งค่าคุกกี้ยอมรับทั้งหมดอ่านเพิ่มเติม
Manage consent

Privacy Overview

This website uses cookies to improve your experience while you navigate through the website. Out of these, the cookies that are categorized as necessary are stored on your browser as they are essential for the working of basic functionalities of the website. We also use third-party cookies that help us analyze and understand how you use this website. These cookies will be stored in your browser only with your consent. You also have the option to opt-out of these cookies. But opting out of some of these cookies may affect your browsing experience.
Necessary
Always Enabled
Necessary cookies are absolutely essential for the website to function properly. These cookies ensure basic functionalities and security features of the website, anonymously.
CookieDurationDescription
cookielawinfo-checkbox-analytics11 monthsThis cookie is set by GDPR Cookie Consent plugin. The cookie is used to store the user consent for the cookies in the category "Analytics".
cookielawinfo-checkbox-functional11 monthsThe cookie is set by GDPR cookie consent to record the user consent for the cookies in the category "Functional".
cookielawinfo-checkbox-necessary11 monthsThis cookie is set by GDPR Cookie Consent plugin. The cookies is used to store the user consent for the cookies in the category "Necessary".
cookielawinfo-checkbox-others11 monthsThis cookie is set by GDPR Cookie Consent plugin. The cookie is used to store the user consent for the cookies in the category "Other.
cookielawinfo-checkbox-performance11 monthsThis cookie is set by GDPR Cookie Consent plugin. The cookie is used to store the user consent for the cookies in the category "Performance".
viewed_cookie_policy11 monthsThe cookie is set by the GDPR Cookie Consent plugin and is used to store whether or not user has consented to the use of cookies. It does not store any personal data.
Functional
Functional cookies help to perform certain functionalities like sharing the content of the website on social media platforms, collect feedbacks, and other third-party features.
Performance
Performance cookies are used to understand and analyze the key performance indexes of the website which helps in delivering a better user experience for the visitors.
Analytics
Analytical cookies are used to understand how visitors interact with the website. These cookies help provide information on metrics the number of visitors, bounce rate, traffic source, etc.
Advertisement
Advertisement cookies are used to provide visitors with relevant ads and marketing campaigns. These cookies track visitors across websites and collect information to provide customized ads.
Others
Other uncategorized cookies are those that are being analyzed and have not been classified into a category as yet.
SAVE & ACCEPT