ThepExcel Logo
  • บทความ
    • Excel
      • Excel ทั่วไป
      • Excel Pivot Table
      • Excel Power Pivot
      • Power Query
      • Excel Array Formula
      • Excel VBA
      • Excel for Business
      • Excel and Maths
      • ฟังก์ชัน Excel ทั้งหมด
    • Power BI
      • Power Query
      • Data Model
      • DAX Formula
      • Power BI Report
    • Coding
      • Excel VBA
      • Python
      • Power Query M Code
    • AI
      • ChatGPT
      • Stable Diffusion
      • MidJourney
    • Highlights : บทความแนะนำ
    • คลิปวีดีโอ
  • อบรม
    • อบรมลูกค้าองค์กร
    • คอร์สออนไลน์ SkillLane
    • แนะนำวิทยากร
    • Excel/Power BI Skill Map
    • Quiz
  • Shop
    • คอร์สออนไลน์
    • สินค้าทั้งหมด
    • หนังสือเล่ม
    • E-Book
    • Cart
  • Download
    • Download ไฟล์จากเทพเอ็กเซล
    • ThepExcel-Mfx : M Code สำเร็จรูป
    • Date Table สำเร็จรูป
    • กราฟ My Skill
    • github.com/ThepExcel
  • รวม Link
    • รวม Link สอน Excel & Power BI ทั้งไทยและเทศ
    • รวม Link เกี่ยวกับ AI
    • รวม Link Coding
    • หนังสือแนะนำ
    • Facebook ThepExcel
    • YouTube ThepExcel
    • DAX Formatter
  • Contact
    • แนะนำ เทพเอ็กเซล (Thep Excel)
    • แนะนำวิทยากร : อาจารย์ ศิระ เอกบุตร (ระ)
    • นโยบายการคุ้มครองข้อมูลส่วนบุคคล (Privacy Policy)
  • Facebook
  • YouTube

การใช้ Excel Power Pivot ตอนที่ 5 : การทำรายงาน Actual vs Target

รายงาน actual vs target report

Categories 📂

Power Pivot

Tags 🏷️

actual, target

การใช้ Pivot Table แบบปกตินั้นเวลาเราจะทำรายงานยอดขาย Actual vs Target เราจะทำต้องทำตาราง Pivot แยกกัน 2 อัน แล้วค่อยเอามาเทียบกันด้วยวิธีอะไรบางอย่าง ไม่ว่าจะ Copy Paste หรือ VLOOKUP มาอยู่ข้างๆ กัน แต่ถ้าหากเราใช้ Concept ของ Data Model เราจะสามารถทำรายงาน Actual vs Target ในตาราง Pivot เดียวได้เลย

สารบัญ

  • โหลดไฟล์ Target
  • วิธีการทำรายงาน Actual vs Target
  • ตารางวันที่
  • จัดการกับ Table Target
  • ศึกษา Power Query เพิ่มเติมได้ที่ไหน?
  • สารบัญซีรีส์ Power Pivot

โหลดไฟล์ Target

โหลดไฟล์ Target ได้ที่นี่

วิธีการทำรายงาน Actual vs Target

จากหลักการของ Data Model ที่เราเรียนมาในตอนที่แล้ว จะช่วยให้เราสามารถทำรายงาน Actual vs Target ได้โดยง่าย แค่หา Dimension Table ที่ Common กัน ระหว่าง Fact Table ที่เป็น Actual กับค่าตัวเลขของตาราง Target เราก็จะสามารถ Filter ข้อมูลจาก Field ที่อยู่ในตาราง Dimension ที่ Common กันนั้น แล้วส่งผลผ่าน Relationship ไปหาทั้งตาราง Actual และ Target พร้อมๆ กันนั่นเอง

เช่นข้อมูลในตาราง Target ผมเป็นแบบนี้

จะเห็นว่าข้อมูลที่พอจะนำไปเชื่อมกับ Dimension ที่ Common กับตาราง Actual ได้ก็คือ สินค้า กับเรื่องของวันที่นั่นเอง

ตอนนี้เรามีตารางสินค้าแล้ว ดังนั้นสิ่งที่เราควรจะทำคือ สร้างตารางวันที่ขึ้นมา

ตารางวันที่

เราสามารถสร้างตารางวันที่แบบที่ 1 บรรทัดคือ 1 วัน หรือ 1 บรรทัดคือ 1 เดือนก็ได้ แล้วแต่เราจะออกแบบ

ซึ่งถ้าเอาละเอียดก็ควรเป็นแบบที่ 1 บรรทัดมี 1 วัน ซึ่งจะสร้างตารางวันที่ใน Excel แล้ว Import เข้า Data Model หรือจะใช้ Power Query สร้างแบบ Dynamic ขึ้นมาก็ได้ (แต่ถ้าใช้ Power BI จะสร้างมารถใช้ DAX แบบ New Table สร้างได้ซึ่งเป็นวิธีที่ง่ายที่สุด)

ซึ่งหากใครอยากจะสร้างตารางวันที่ระดับวัน สามารถทำตามที่เคยได้แนะนำในบทความนี้ได้เลย

แต่เพื่อความง่าย ในบทความนี้เราจะทำตารางวันที่ในระดับเดือนละกัน (สมมติว่าในรายงานของเราจะทำสรุปแค่ระดับเดือน)

ดังนั้นเดี๋ยวผมจะเอาข้อมูลวันที่จาก Target ไปทำเป็นตารางวันที่ซะเลย โดยเดี๋ยวเราจะเปิดไฟล์หลัก (DataModel) แล้วทำการ Get Data จากไฟล์ Target แค่ปีกับเดือน แล้วแยกไปเป็น Query ใหม่ชื่อ DateTable ดังนี้

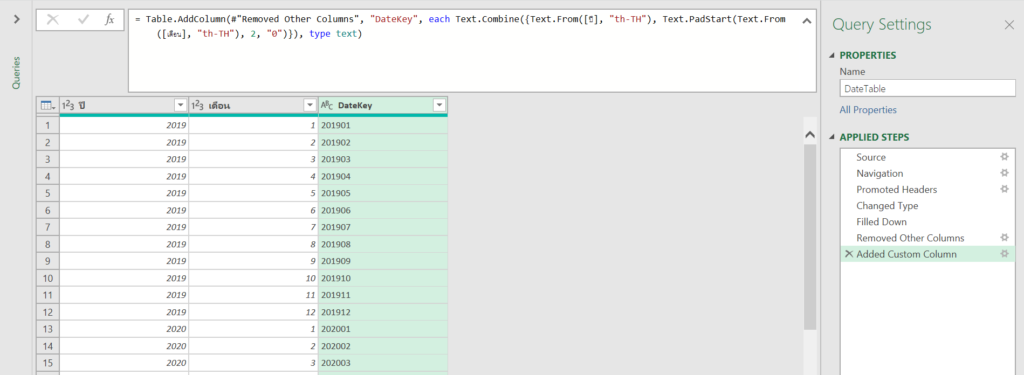
มาถึง คอลัมน์ปีมันเว้นว่างไว้ ก็สั่ง คลิ๊กขวา -> Fill Down ซะ แล้ว Remove Other Columns

จากนั้นก็ Add Column -> Column from Example แล้วสร้าง Field ที่เชื่อมปีกับเดือนซะ แบบนี้ ซึ่งมันจะสร้างสูตรให้ว่า

Text.Combine({Text.From([ปี], "th-TH"), Text.PadStart(Text.From([เดือน], "th-TH"), 2, "0")})

ผมตั้งชื่อคอลัมน์ใหม่นี้ว่า DateKey เป็นอันจบ

จากนั้นก็กด Close&Load to… แบบ Connection Only แต่ให้ติ๊ก Load เข้า Data Model ซะ

จัดการกับ Table Target

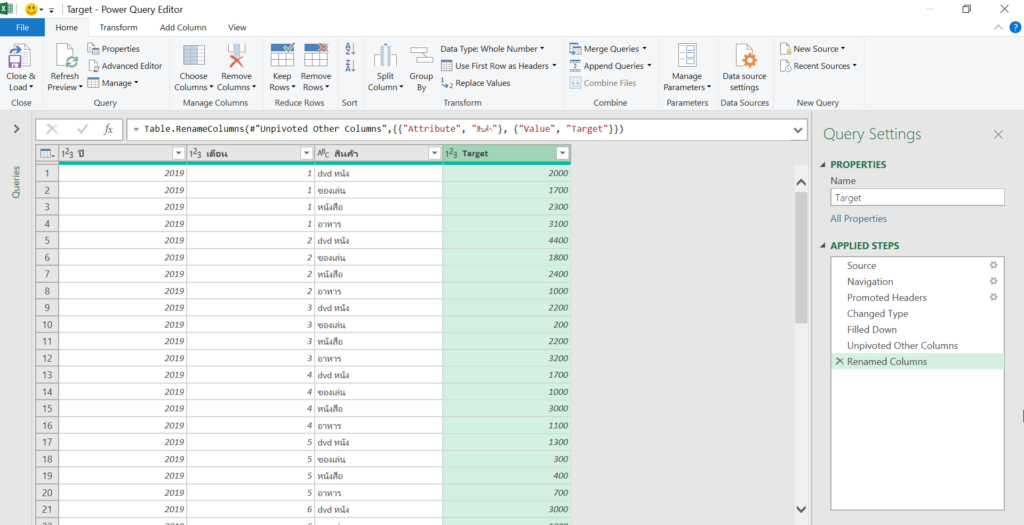
ต่อไปเราจัดการกับไฟล์ Target ให้กลายเป็นข้อมูลเชิง Database ที่เรียบร้อยขึ้นด้วยการ Get Data ใหม่อีกที จากนั้น Fill Down ปี แล้ว Unpivot สินค้าลงมาให้หมด ได้ดังนี้

คราวนี้เราจะไปทำ DateKey ใน Data Model บ้าง ขี้เกียจใช้ Column From Example เหมือนเดิมละ (เปลี่ยนวิธีบ้าง จะได้เห็นวิธีทำหลายๆ แบบเนอะ) ดังนั้นเรา Load Data นี้เข้า Data Model ไปเลย

จากนั้นเราเข้าไปดู Target ใน Power Pivot จะเห็นแบบนี้ (ซึ่งเป็นผลลัพธ์ของ Power Query)

ต่อไปเราจะสร้างคอลัมน์ใหม่ให้เป็น DateKey ด้วย DAX ดังนี้

DateKey:=Target[ปี]&FORMAT(Target[เดือน],"00")
  • ซึ่งเราจะอ้างอิงคอลัมน์ด้วย ชื่อตาราง[ชื่อคอลัมน์]
  • ฟังก์ชัน FORMAT จะเหมือนกับฟังก์ชัน TEXT ของ Excel มีความสามารถในการแปลง Value ตัวเลขให้เป็น Text ที่มีหน้าตาตาม Custom Number Format ที่กำหนดได้ (ซึ่งผมกำหนดให้เป็นเลข 2 หลัก ด้วย 00)
  • จากนั้นเอามาเชื่อมกันด้วย &

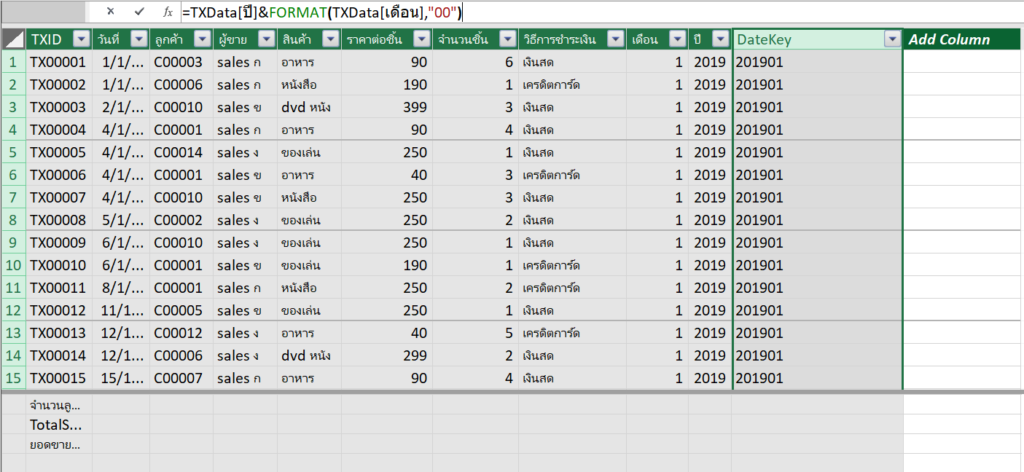
เราทำแบบนี้กับตารางหลัก ซึ่งก็คือ TXDate เช่นกัน

DateKey:=TXData[ปี]&FORMAT(TXData[เดือน],"00")

จากนั้นมาดู Data Model ที่ Diagram View

0ากนั้นให้ทำการผูก Relationship เพิ่มเติมซะ

จากนั้น Add Measure Total Target เข้าไปในตาราง Target ซะ

แค่นี้เราก็พร้อมจะทำรายงาน Actual vs Target แล้ว

แค่ต้องลาก Field จากตาราง Dimension ที่ Common กันระหว่างตาราง Actual กัย Target แค่นี้ก็ดูข้อมูลเทียบกันได้แล้ว

ถ้าอยากรู้ว่า Actual ทำได้กี่ % เมื่อเทียบกับ Target ก็สร้าง Measure เพื่อจับหารกันได้ แต่การหารแบบดัก Error ให้เป็น Blank ได้สามารถใช้ฟังก์ชัน DIVIDE ใน DAX มาช่วยได้เลยดังนี้

=DIVIDE([TotalSales],[TotalTarget])

แค่นี้ก็สามารถแสดง %Achievement ได้แล้ว ไม่ต้อง Copy Paste, ไม่ต้อง VLOOKUP อะไรทั้งสิ้น

รายงาน actual vs target report

และนี่ก็คือตัวอย่างการทำรายงานแบบ Actual vs Target ด้วย Power Pivot ครับใครทำตามแล้วสงสัยอะไรก็สามารถ Comment ถามได้นะครับ

ศึกษา Power Query เพิ่มเติมได้ที่ไหน?

ในบทความนี้มีการใช้ Power Query มาช่วยจัดการข้อมูลพอสมควร ใครเห็นแล้วสนใจ อยากจะศึกษาให้ลึกซึ้งกว่านี้ สามารถศึกษาได้จาก คอร์สออนไลน์ Excel Power Up (เข้าไปดูเนื้อหาบางส่วนได้ฟรี)

excel power up online

หรือถ้าชอบแบบอ่านหนังสือ ก็ศึกษาได้จาก หนังสือ Excel Power Upได้เลยครับ (สามารถอ่านเนื้อหาฟรีๆ บางส่วนได้ที่นี่)

  • หนังสือ Excel Power Up! : เพิ่มพลังการใช้ Excel ของคุณด้วย Power Query (E-BOOK)
    หนังสือ Excel Power Up! : เพิ่มพลังการใช้ Excel ของคุณด้วย Power Query (E-BOOK)
    Sale Product on sale
    ฿379.00 ฿299.00
    ไปซื้อ EBook ที่ MEB
  • หนังสือ Excel Power Up! : เพิ่มพลังการใช้ Excel ของคุณด้วย Power Query
    หนังสือ Excel Power Up! : เพิ่มพลังการใช้ Excel ของคุณด้วย Power Query
    Sale Product on sale
    ฿379.00 ฿339.00
    Rated 5.00 out of 5 based on 2 customer ratings
    Read more

สารบัญซีรีส์ Power Pivot

  • วิธีกำหนดให้ Pivot Table แสดงเฉพาะแถว/คอลัมน์ที่ต้องการ
  • การใช้ Excel Power Pivot ตอนที่ 1 : การใช้งานพื้นฐาน
  • การใช้ Excel Power Pivot ตอนที่ 2 : ทำผลสรุป Value ให้เป็นข้อความด้วย DAX
  • การใช้ Excel Power Pivot ตอนที่ 3 : ลาก่อน VLOOKUP สวัสดี Data Model
  • การใช้ Excel Power Pivot ตอนที่ 4 : Data Model ทำงานอย่างไร
  • การใช้ Excel Power Pivot ตอนที่ 5 : การทำรายงาน Actual vs Target
  • Inventory Management ทำรายงานสินค้าคงคลังด้วย DAX และ Data Model ใน Excel
  • วิธีดับเบิ้ลคลิ๊กแสดงข้อมูลรายะเอียดใน Pivot แบบ Data Model ให้เกิน 1000 บรรทัด
  • หลากวิธีเอาข้อมูลในกลุ่มเดียวกันไปรวมเป็นข้อความเดียวกัน
แชร์ความรู้ให้เพื่อนๆ ของคุณ


ติดตามเทพเอ็กเซล

  • Facebook
  • YouTube

อบรมกับเทพเอ็กเซล

🔥 คอร์สใหม่ล่าสุด 🔥

การทำ Optimization ด้วย Excel Solver
สำหรับงานวางแผน
คอร์สออนไลน์ เทพเอ็กเซล
คอร์สออนไลน์ จากเทพเอ็กเซล ดูกี่รอบก็ได้
อบรม Excel / Power BI ให้องค์กรของคุณ

บทความล่าสุด

  • แนวทางฝึกฝน Excel ให้เก่งขึ้น
  • รวม Link เว็บ/เพจเกี่ยวกับ AI
  • วิธีกำหนดท่าทางแบบให้ได้ดั่งใจด้วย ControlNet ใน Stable Diffusion [Part4]
  • วิธีสั่ง Prompt และตั้งค่าใน Stable Diffusion ให้รูปสวยโดนใจ [Part3]
  • วิธีเรียกใช้งาน Model เจ๋งๆ ใน Stable Diffusion [ตอนที่2]
  • วิธีใช้งาน AI สร้างรูปสุดเจ๋งและฟรีด้วย Stable Diffusion ฉบับมือใหม่ [ตอนที่1]
  • 10 ไอเดีย เรียนรู้ Excel ผ่าน ChatGPT AI สุดเจ๋ง

บทความแนะนำ

🔥ฟังก์ชันทั้งหมดใน Excel 🔥

  • แกะเคล็ดวิชา Excel Wizard ในการแข่ง Speed Run Excel ระดับโลก
  • เจาะลึก CALCULATE ใน DAX แบบลึกสุดใจ : Part 1
  • Series สอนดึงข้อมูลจากเว็บ ด้วย Power Automate Desktop
  • สรุปการใช้ LAMBDA ฟังก์ชันที่ใช้สร้างฟังก์ชันใน Excel 365 และผองเพื่อน
  • วิธีใช้ Excel คำนวณระยะเวลาการทำงานรวม แถมระบุเวลาพักได้แบบยืดหยุ่น
  • วิธีจัดการข้อมูลแย่ๆ ด้วย Power Query ทั้งข้อมูลปนกัน ข้อมูลอยู่บนหัวตาราง
  • แยกข้อมูลที่อยู่สุดเน่า ด้วย Excel Power Query

Categories

Tags

ai collection concepts copy database Data Model data validation date dax dropdown error excel filter finance find format formula function game graph IF index intro inventory len link logic lookup match m code merge mid overview paste pivot power query right row solver sort speed split substitute table text time tips trim vba vlookup

Archives

  • April 2023 (3)
  • March 2023 (2)
  • February 2023 (2)
  • January 2023 (1)
  • October 2022 (1)
  • September 2022 (3)
  • August 2022 (3)
  • July 2022 (1)
  • June 2022 (3)
  • May 2022 (1)
  • April 2022 (2)
  • February 2022 (1)
  • December 2021 (2)
  • November 2021 (10)
  • September 2021 (2)
  • August 2021 (6)
  • July 2021 (2)
  • June 2021 (2)
  • May 2021 (10)
  • April 2021 (3)
  • March 2021 (3)
  • February 2021 (4)
  • January 2021 (8)
  • December 2020 (5)
  • November 2020 (13)
  • October 2020 (5)
  • September 2020 (11)
  • August 2020 (4)
  • July 2020 (13)
  • June 2020 (17)
  • May 2020 (16)
  • April 2020 (16)
  • March 2020 (10)
  • February 2020 (15)
  • January 2020 (16)
  • December 2019 (4)
  • November 2019 (3)
  • October 2019 (9)
  • September 2019 (1)
  • August 2019 (7)
  • June 2019 (3)
  • May 2019 (9)
  • April 2019 (9)
  • March 2019 (2)
  • February 2018 (1)
  • January 2018 (3)
  • November 2017 (3)
  • August 2017 (1)
  • July 2017 (1)
  • June 2017 (1)
  • May 2017 (6)
  • April 2017 (6)
  • March 2017 (7)
  • February 2017 (1)
  • January 2017 (2)
  • December 2016 (1)
  • October 2016 (2)
  • September 2016 (3)
  • August 2016 (2)
  • July 2016 (2)
  • June 2016 (1)
  • May 2016 (1)
  • April 2016 (1)
  • March 2016 (2)
  • February 2016 (1)
  • January 2016 (2)
  • December 2015 (2)
  • November 2015 (5)
  • October 2015 (3)
  • June 2015 (2)
  • May 2015 (1)
  • April 2015 (26)
  • January 2015 (1)
  • December 2014 (1)
  • November 2014 (2)
  • October 2014 (1)
  • September 2014 (2)
  • August 2014 (1)
  • June 2014 (1)
  • May 2014 (1)
  • April 2014 (3)
  • March 2014 (3)
  • February 2014 (12)
  • January 2014 (7)
  • December 2013 (2)
  • November 2013 (8)
  • October 2013 (2)

เทพเอ็กเซล : Thep Excel

copyright © 2022

  • Facebook
  • YouTube
เว็บไซต์นี้ใช้คุกกี้ (Cookies)
บริษัท เทพเอ็กเซล จำกัด ให้ความสำคัญต่อข้อมูลส่วนบุคคลของท่าน เพื่อการพัฒนาและปรับปรุงเว็บไซต์รวมถึงสินค้าและบริการต่างๆ หากท่านใช้บริการเว็บไซต์นี้ โดยไม่มีการปรับตั้งค่าใดๆ แสดงว่าท่านยินยอมที่จะรับคุกกี้บนเว็บไซต์ และนโยบายสิทธิส่วนบุคคลของเรา
ตั้งค่าคุกกี้ยอมรับทั้งหมดอ่านเพิ่มเติม
Manage consent

Privacy Overview

This website uses cookies to improve your experience while you navigate through the website. Out of these, the cookies that are categorized as necessary are stored on your browser as they are essential for the working of basic functionalities of the website. We also use third-party cookies that help us analyze and understand how you use this website. These cookies will be stored in your browser only with your consent. You also have the option to opt-out of these cookies. But opting out of some of these cookies may affect your browsing experience.
Necessary
Always Enabled
Necessary cookies are absolutely essential for the website to function properly. These cookies ensure basic functionalities and security features of the website, anonymously.
CookieDurationDescription
cookielawinfo-checkbox-analytics11 monthsThis cookie is set by GDPR Cookie Consent plugin. The cookie is used to store the user consent for the cookies in the category "Analytics".
cookielawinfo-checkbox-functional11 monthsThe cookie is set by GDPR cookie consent to record the user consent for the cookies in the category "Functional".
cookielawinfo-checkbox-necessary11 monthsThis cookie is set by GDPR Cookie Consent plugin. The cookies is used to store the user consent for the cookies in the category "Necessary".
cookielawinfo-checkbox-others11 monthsThis cookie is set by GDPR Cookie Consent plugin. The cookie is used to store the user consent for the cookies in the category "Other.
cookielawinfo-checkbox-performance11 monthsThis cookie is set by GDPR Cookie Consent plugin. The cookie is used to store the user consent for the cookies in the category "Performance".
viewed_cookie_policy11 monthsThe cookie is set by the GDPR Cookie Consent plugin and is used to store whether or not user has consented to the use of cookies. It does not store any personal data.
Functional
Functional cookies help to perform certain functionalities like sharing the content of the website on social media platforms, collect feedbacks, and other third-party features.
Performance
Performance cookies are used to understand and analyze the key performance indexes of the website which helps in delivering a better user experience for the visitors.
Analytics
Analytical cookies are used to understand how visitors interact with the website. These cookies help provide information on metrics the number of visitors, bounce rate, traffic source, etc.
Advertisement
Advertisement cookies are used to provide visitors with relevant ads and marketing campaigns. These cookies track visitors across websites and collect information to provide customized ads.
Others
Other uncategorized cookies are those that are being analyzed and have not been classified into a category as yet.
SAVE & ACCEPT