

ในตอนนี้เราจะมาเรียนรู้เรื่องการปรับแต่งสีใน Visual ด้วย Conditional Format ซึ่งก็จะยังจะใช้ไฟล์เดิมกับตอนที่ 4 มาทำงานต่อนะครับ (ตอนสุดท้ายแล้วล่ะ) เดี๋ยวตอนหน้าเราจะเริ่มทำตั้งแต่ไฟล์ Power BI เปล่าๆ แล้ว Get Data กันใหม่ จาก Excel และ Folder ที่มี CSV หลายไฟล์อยู่ในนั้นนะครับ ความมันส์ที่แท้จริงกำลังจะมาถึงแล้ว 555
สีโดยพื้นฐานของ Power BI นั้นมาจาก Theme
เราสามารถเปลี่ยน Theme สีได้ในเมนู Home แล้วเลือก Switch Theme ซึ่งมี Theme Gallery ให้ Download ด้วยนะ (ต้องโหลดไฟล์ นามสกุล .json มาจาก gallery ใน internet แล้วกด import theme ในโปรแกรมแล้วเลือกไฟล์ที่โหลดมา)

พอเราเปลี่ยน Theme ปุ๊ป สีต่างๆ ก็จะเปลี่ยนทั้งชุดเลย
อย่างไรก็ตาม เวลาสื่อสาร Visual การแสดงสีให้มีความหมายมากกว่าแค่เป็น Category ธรรมดา โดยให้ขึ้นกับค่าต่างๆ เช่น อัตรากำไร มันน่าจะสื่อสารข้อมูลได้ดียิ่งขึ้นนะ ดังนั้นเรามาเรียนรู้วิธีกำหนด Conditional Format เพื่อทำเรื่องนั้นกันเถอะ
Conditional Format สุดเจ๋ง
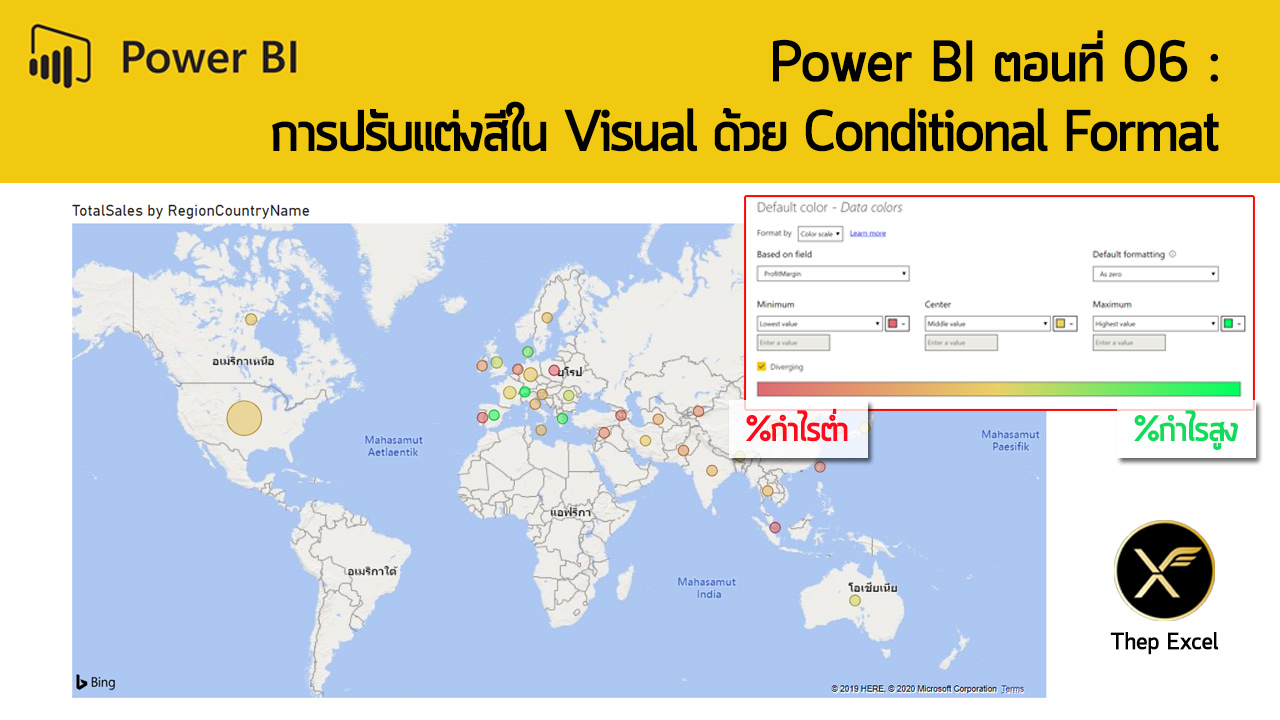
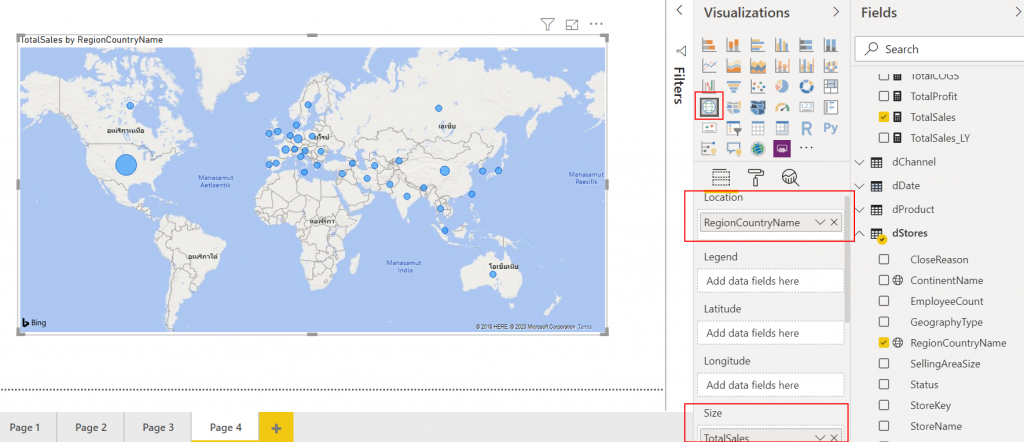
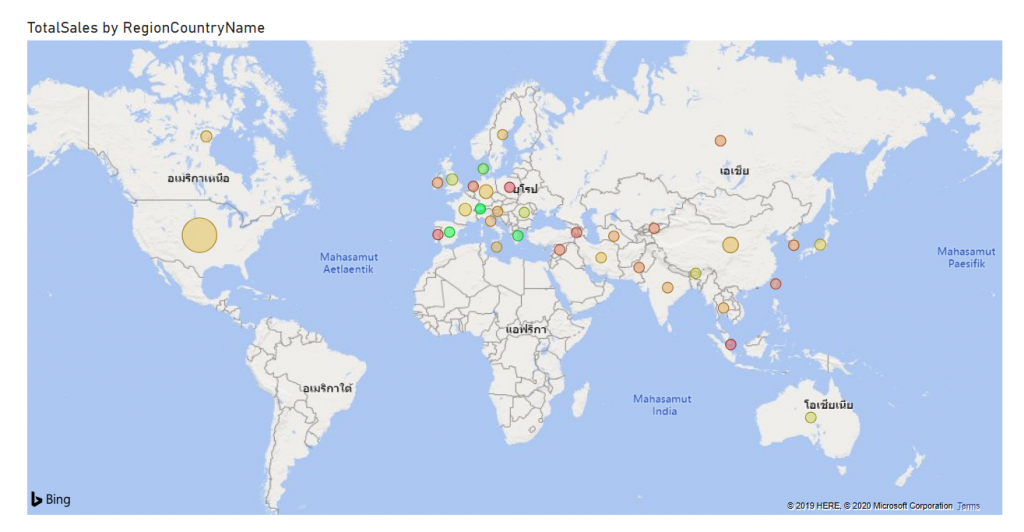
คราวนี้ผมสร้างกราฟแผนที่บ้าง โดยเลือก RegionCountryName มาดูโดยให้ TotalSales เป็น Size (ยิ่งขายได้ยอดเยอะ วงกลมก็จะยิ่งใหญ่)
ป.ล. กราฟแผนที่ต้องใช้ Internet ด้วยนะ ไม่งั้นมันไม่ขึ้น
ผมคิดว่า ในเมื่อเราดูยอดขายจากขนาดวงกลมได้แล้ว ผมเลยอยากให้สีของวงกลมแสดงถึงอัตรากำไร หรือ ProfitMargin บ้าง จะได้เห็นข้อมูลได้หลายมิติมากขึ้น (ซึ่งผมได้สร้าง Measure ไว้แล้วแต่แรกว่า เกิดจาก TotalProfit/TotalSales )
นี่แหละถึงคราวที่จะต้องใช้ Conditional Format แล้ว!!
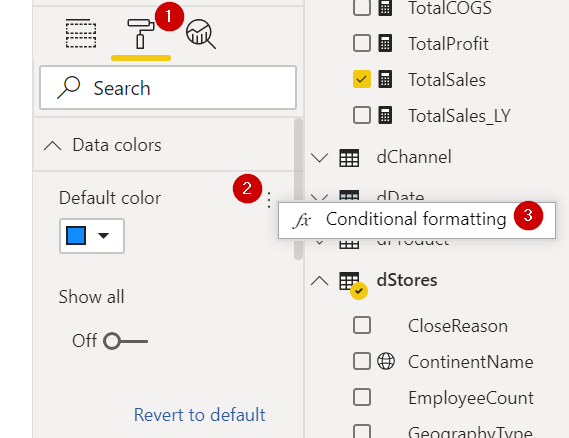
Visual ส่วนใหญ่จะซ่อน Conditional Format ไว้
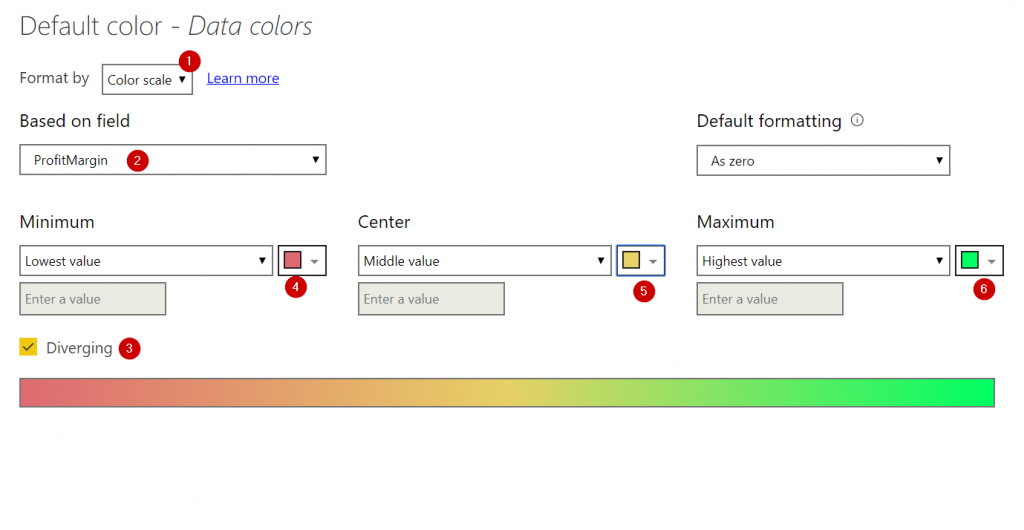
เราสามารถกำหนดสีตามค่าใน Measure ที่ต้องการได้ โดยใช้ Conditional Format มาช่วย ซึ่งในหลายๆ Visual มันก็หลบๆ ซ่อนๆ อยู่ในแปรงทาสี เช่น ในส่วน Data Color ของกราฟแผนที่ตัวนี้ ซึ่งสามารถกดที่ … (จุด 3 อัน) หรือจะกดคลิ๊กขวาที่พื้นที่ว่างก็ได้ แล้วกด Conditional Formatting (โคตรงงว่าคนออกแบบมันจะซ่อนเมนูนี้ไว้ทำไมฟะ…)
สมมติผมอยากให้มันไล่สีจากสีนึงไปอีกสี ผมก็สามารถใช้แบบ Color Scale ได้ และที่สำคัญคือเราสามารถกำหนดให้มันไล่สีโดยยึดจาก Measure ชื่อ ProfitMargin ได้ (แม้ Measure นี้ไม่ได้อยู่ใน Visual แต่แรกด้วยซ้ำ)
ซึ่งมี tips เล็กๆ น้อยๆ ว่าให้เลือก Diverging ด้วยเพื่อให้เราสามารถกำหนดสีตรงกลางได้ (ถ้าไม่กำหนด สีจะค่อนข้างเน่า ไม่สวย)
แค่นี้เราก็สามารถให้มันสามารถแสดงสีที่ต่างกันโดยขึ้นกับกำไรได้แล้ว แบบนี้ก็จะเห็นชัดขึ้นว่าประเทศแถวยุโรปมีหลายตัวที่กำไรดี (สีเขียว)
ในทำนองเดียวกันกราฟแท่งมันก็ซ่อน Conditional Format ไว้อยู่ในแปรงทางสี จุด 3 อัน เหมือนกัน คราวนี้ผมเปลี่ยนเป็นแบบ Rules แทน Color Scale บ้าง เพื่อกำหนดได้เลยว่าค่ามากกว่าเท่าไหร่ น้อยกว่าเท่าไหร่ ให้เป็นสีอะไร

Visual ที่แสดง Conditional Format ชัดๆ
Visual ที่มีเมนู Conditional Format ให้เห็นชัดๆ เลย ในแปรงทาสีก็คือพวกตาราง Table กับ Matrix นี่แหละ ซึ่งปรับ Conditional Format ได้หลากหลายกว่าแบบที่ซ่อนอยู่ เช่น จะทำเป็น Data Bar หรือ Icon Set ก็ได้
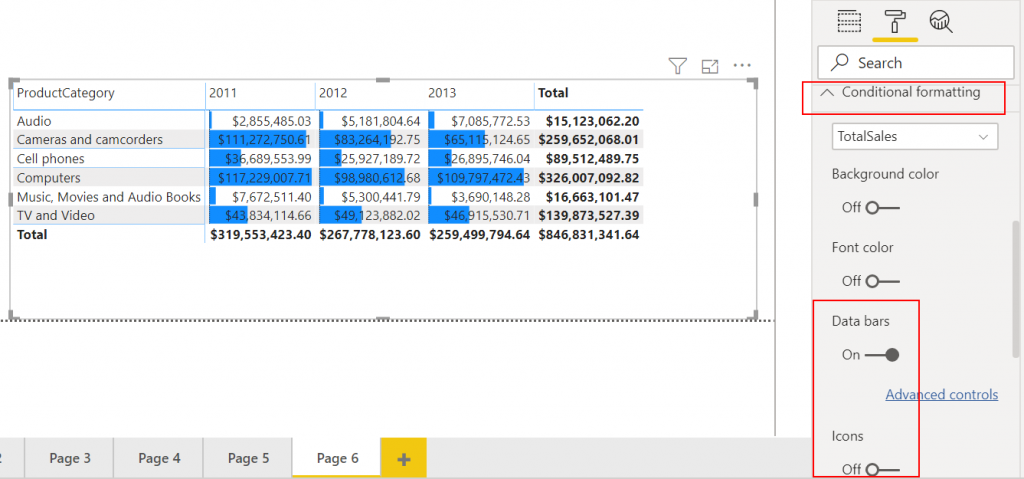
และแน่นอนว่าเรายังสามารถตั้ง Conditional Format Based on Measure อื่นได้ เช่น Profit Margin

ไม่ใช้ Conditional Format ก็ได้
ถ้าเราอยากกำหนดสีให้แต่ละ Category เอง โดยไม่ใช้ Conditional Format ก็ได้นะ
สมมติว่าเราอยากจะเน้นการนำเสนอไปที่ Camera and Camcorders เราอาจจะปรับสีของมันให้เด่นอยู่อันเดียวก็ได้ โดยไปที่แปรงทาสี แล้ว Data Color จากนั้นให้ติ๊กเลือก Show all เพื่อให้สามารถกำหนดสีของแต่ละแท่งได้อย่างอิสระนั่นเอง

บทนี้จบแล้วล่ะ
เอาล่ะ คิดว่าทุกคนน่าจะพอเห็นภาพแล้วว่า การทำ Report เบื้องต้นทันทำอะไรได้ ซึ่งจริงๆ ยังทำได้อีกเยอะมาก เช่น Page Tool Tips / Bookmark / Button แต่เดียวเราค่อยมาว่ากันทีหลัง
เดี๋ยวบทถัดไปเราจะมาเริ่มสร้างงานจากไฟล์เปล่าๆ กันล่ะ เพื่อที่จะดูว่า กว่าจะมาเป็นไฟล์ Power BI ที่พร้อมให้เล่นได้ เราต้องผ่านอะไรมาบ้าง ^^
สารบัญ Series Power BI
- POWER BI ตอนที่ 01: POWER BI คืออะไร?
- POWER BI ตอนที่ 02: พื้นฐาน EXCEL ที่สำคัญก่อนจะเรียนรู้ POWER BI
- POWER BI ตอนที่ 03: ภาพรวมการใช้งาน POWER BI DESKTOP
- POWER BI ตอนที่ 04: สร้าง REPORT แรก ใน POWER BI
- POWER BI ตอนที่ 05: วิธีการ DRILL เพื่อเจาะลึกข้อมูลใน REPORT
- POWER BI ตอนที่ 06: การปรับแต่งสีใน VISUAL ด้วย CONDITIONAL FORMAT
- POWER BI ตอนที่ 07: เริ่ม GET DATA ตั้งแต่ไฟล์ยังว่างเปล่า
- POWER BI ตอนที่ 08: สร้าง DATA MODEL ที่เหมาะสม
- POWER BI ตอนที่ 09: สร้าง DATE TABLE ด้วย DAX
- POWER BI ตอนที่ 10: เรียนรู้ DAX เบื้องต้น
- POWER BI ตอนที่ 11: เรียนรู้ DAX Table Function – FILTER
- POWER BI ตอนที่ 12: DISTINCT, VALUES, ALL และผองเพื่อน
- POWER BI ตอนที่ 13: CALCULATE ฟังก์ชันที่ทรงพลังที่สุดใน DAX
- Power BI ตอนที่ 14: Context Transition และ พลังแฝงใน Measure
- Power BI ตอนที่ 15: วิธีดึงค่าจาก Slicer มาคำนวณใน Report
- Power BI ตอนที่ 16 : เดินทางข้ามเวลาไปกับ Time Intelligence DAX Function
- Power BI ตอนที่ 17 : วิธีทำรายงานเทียบเป้าหมาย Target vs Actual
- Power BI ตอนที่ 18 : วิธีการกระจายเป้า Allocate Target ด้วย DAX
- Power BI ตอนที่ 19 : การปรับ Cross Filter Direction เพื่อคำนวณค่าในตาราง Dimension
- ส่วนเสริม
- การคำนวณต้นทุนแบบ FIFO ด้วย DAX
- แสดงข้อมูลสรุปแบบ Top N + Others (ฉบับเทพเอ็กเซล)
- การวิเคราะห์ Event ที่มีช่วงเวลาเริ่มต้นกับสิ้นสุดคนละวัน
- เปรียบเทียบ MAX vs LASTDATE ในภาษา DAX
ใครสนใจอยากเรียนเป็นคลิปวีดีโอ ผมมี