ThepExcel Logo
  • บทความ
    • Excel
      • Excel ทั่วไป
      • Excel Pivot Table
      • Excel Power Pivot
      • Power Query
      • Excel Array Formula
      • Excel VBA
      • Excel for Business
      • Excel and Maths
      • ฟังก์ชัน Excel ทั้งหมด
    • Power BI
      • Power Query
      • Data Model
      • DAX Formula
      • Power BI Report
    • Coding
      • Excel VBA
      • Python
      • Power Query M Code
    • AI
      • ChatGPT
      • Stable Diffusion
      • MidJourney
    • Highlights : บทความแนะนำ
    • คลิปวีดีโอ
  • อบรม
    • อบรมลูกค้าองค์กร
    • คอร์สออนไลน์ SkillLane
    • แนะนำวิทยากร
    • Excel/Power BI Skill Map
    • Quiz
  • Shop
    • คอร์สออนไลน์
    • สินค้าทั้งหมด
    • หนังสือเล่ม
    • E-Book
    • Cart
  • Download
    • Download ไฟล์จากเทพเอ็กเซล
    • ThepExcel-Mfx : M Code สำเร็จรูป
    • Date Table สำเร็จรูป
    • กราฟ My Skill
    • github.com/ThepExcel
  • รวม Link
    • รวม Link สอน Excel & Power BI ทั้งไทยและเทศ
    • รวม Link เกี่ยวกับ AI
    • รวม Link Coding
    • หนังสือแนะนำ
    • Facebook ThepExcel
    • YouTube ThepExcel
    • DAX Formatter
  • Contact
    • แนะนำ เทพเอ็กเซล (Thep Excel)
    • แนะนำวิทยากร : อาจารย์ ศิระ เอกบุตร (ระ)
    • นโยบายการคุ้มครองข้อมูลส่วนบุคคล (Privacy Policy)
  • Facebook
  • YouTube

Power BI ตอนที่ 19 : การปรับ Cross Filter Direction เพื่อคำนวณค่าในตาราง Dimension

cross filter direction

Categories 📂

Data Model, DAX Formula

Tags 🏷️

cross filter

บทความนี้จะสอนเรื่องการปรับค่า Cross Filter เพื่อให้สามารถคำนวณข้อมูลที่อยู่ในตาราง Dimension จากตารางอื่นได้ แต่ก่อนจะไปดูเรื่องนั้น มาทวนเรื่องการคำนวณกรณีที่ Measure หลักอยู่ใน Fact Table กันซะก่อนครับ

เมื่อ Measure หลัก คำนวณจากข้อมูลใน Fact Table

ในตอนที่ 14 เรื่องของ Context Transition ผมมีเขียนสูตรอธิบายการใช้ CALCULATE ผสมกับพวก SUMX AVERAGEX MAXX (เรียกว่า Iterator) ซึ่งจะสามารถเพิ่มการคำนวณมุมมองใหม่ๆ ให้กับ Measure หลัก ซึ่งคำนวณจากข้อมูลในตาราง Fact ผ่านมุมมองต่างๆ ของตาราง Dimension เช่น

TotalRevenue = 
SUMX(fSales,fSales[SalesQuantity]*RELATED(dProduct[UnitPrice])) 

จะเห็นว่า TotalRevenue คำนวณจากตาราง fSales ดังนั้นจึงสามารถ Filter จากตารางอื่นได้เมื่อเราใช้ พวก SUMX AVERAGEX MAXX สร้างตารางจำลองขึ้นมา แล้วเกิด Context Transition ขึ้น

TotalRevenue เฉลี่ยรายร้านค้า

AverageStoreRevenue = 
AVERAGEX(DISTINCT(dStores[StoreKey]),[TotalRevenue])

TotalRevenue เฉลี่ยราย Category สินค้า

AvgProductCategoryRevenue = 
AVERAGEX( DISTINCT(dProduct[ProductCategory]) , [TotalRevenue] )

TotalProfit ที่มากสุดรายสินค้า

MaxProductCategoryProfit = 
MAXX( DISTINCT(dProduct[ProductCategory]) ,[TotalGrossProfit] )

ซึ่งจะเห็นว่าเราสามารถสร้างมุมมองต่างๆ เพิ่มได้ไม่จำกัด หาก Measure หลักนั้นคำนวณจากข้อมูลซึ่งอยู่ที่ Fact Table แต่ถ้า Measure หลักไม่ได้คำนวณจากคอลัมน์ใน Fact Table ล่ะ? ในบทความนี้เราจะมาดูวิธีจัดการกันครับ

เมื่อ Measure หลัก คำนวณจากข้อมูลใน Dimension Table

ใน Data Model ด้านบน สมมติผมต้องการคำนวณ Max UnitPrice ก็เลยสร้าง Measure ขึ้นมาว่า

MaxUnitPrice = MAX(dProduct[UnitPrice])

ซึ่งจะเห็นว่ามันคำนวณจากข้อมูลในตาราง dProduct เต็มๆ เลย

ดังนั้นมันจึงไม่สามารถถูก Filter ได้ด้วยตารางอื่นเลยนอกจาก dProduct ตัวเดียวเท่านั้น (ทั้งนี้เพราะว่าทิศทางของ Relationship มันย้อนศรไม่ได้)

เวลาเราเอา Measure นี้ไปใช้ใน Visual mี่มีการ Filter จากตารางอื่น (เช่น dDate) ผลลัพธ์ก็จะผิดทันที ซึ่งจะเห็นชัดว่า ค่าทุกตัวเท่ากันหมดเพราะว่าไม่ได้มีการ Filter เกิดขึ้นเลย นั่นเอง

แนวทางแก้ไขมีอยู่ 2 วิธี คือ

  1. ปรับทิศทาง Cross Filter ในเส้น Relationship ของ Data Model เป็น Both Direction เสมอ (ไม่แนะนำ)
  2. ใช้ฟังก์ชัน CROSSFILTER มาช่วยใน CALCULATE เพื่อปรับเป็น Both เฉพาะการคำนวณ Measure นั้นๆ (แนะนำ)

ปรับทิศทาง Cross Filter ในเส้น Relationship ของ Data Model เป็น Both Direction

วิธีนี้ไม่ต้องเขียนสูตรอะไรทั้งสิ้น เพราะเป็นการไปปรับที่เส้น Relationship ใน Data Model เองเลย โดยให้ดับเบิ้ลคลิ๊กที่เส้นตัวเจ้าปัญหา

จากนั้นเลือก Cross Filter Direction เป็น Both เพื่อให้มันสามารถ Filter ได้ทั้ง 2 ทิศทาง

Cross Filter Direction

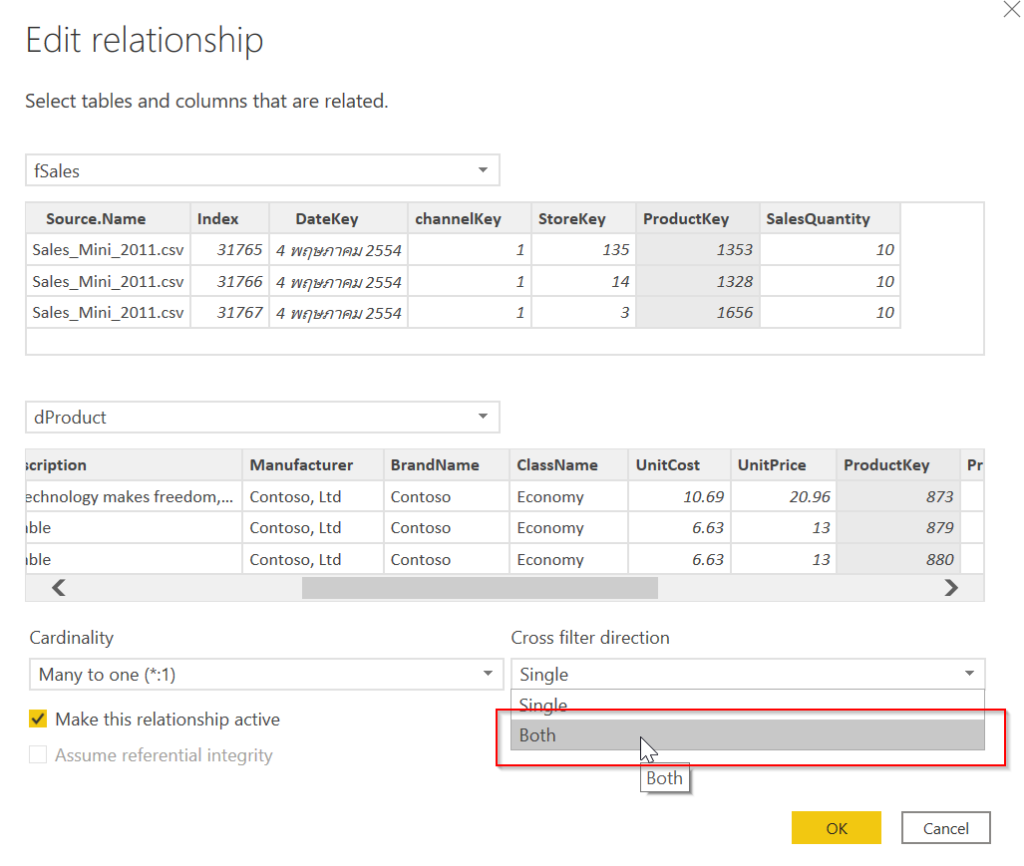
พอปรับเป็น both แล้ว ลูกศรก็จะหันไปทั้ง 2 ทิศทาง แปลว่ามันยอมให้เรา Filter จากตารางอื่นได้แล้ว

หากไปดูผลลัพธ์ใน Visual ก็จะถูกต้องแล้ว

อย่างไรก็ตามผมไม่แนะนำวิธีนี้ เนื่องจาก Data Model อาจเกิดความกำกวมได้ ว่าจะให้ Filter จากทิศไหนไปไหนกันแน่ ดังนั้นเรามาดูอีกวิธีกัน

ใช้ฟังก์ชัน CROSSFILTER มาช่วยใน CALCULATE เพื่อปรับเป็น Both เฉพาะการคำนวณ Measure นั้นๆ

วิธีนี้ ใน Data Model เราจะยังคงเป็นทิศทางเดียว คือ Single อยู่ แต่คราวนี้เราจะเขียน Measure ตัวใหม่ ให้รองรับการ Filter แบบ 2 ทิศทางได้ โดยใช้ CALCULATE+CROSSFILTER

CROSSFILTER ( <LeftColumnName>, <RightColumnName>, <CrossFilterType> )

โดยที่ CROSSFILTER มีความสามารถในการเปลี่ยนรูปแบบการ Cross Filter หรือ <CrossFilterType> จาก Relationship ที่มีอยู่แล้วให้เป็น Both, None, OneWay ได้ ซึ่งจะต้องใช้ฟังก์ชันนี้คู่กับ CALCULATE ในฐานะของ Filter เช่น

MaxUnitPriceV2 = 
CALCULATE(MAX(dProduct[UnitPrice]),
        CROSSFILTER(dProduct[ProductKey],fSales[ProductKey],Both)
        )

ซึ่งแม้ว่าใน Data Model เส้น Relationship จะยังเป็น Single อยู่ แต่ใน Measure MaxUnitPriceV2 นี้จะสามารถใช้ Relationship แบบ Both ได้ แบบนี้จะไม่ทำให้ตัว Model เสีย และยังสามารถคำนวณได้ถูกต้องอีกด้วย แบบนี้สิ แนะนำเลย!

สารบัญ Series Power BI

  • POWER BI ตอนที่ 01: POWER BI คืออะไร?
  • POWER BI ตอนที่ 02: พื้นฐาน EXCEL ที่สำคัญก่อนจะเรียนรู้ POWER BI
  • POWER BI ตอนที่ 03: ภาพรวมการใช้งาน POWER BI DESKTOP
  • POWER BI ตอนที่ 04: สร้าง REPORT แรก ใน POWER BI
  • POWER BI ตอนที่ 05: วิธีการ DRILL เพื่อเจาะลึกข้อมูลใน REPORT
  • POWER BI ตอนที่ 06: การปรับแต่งสีใน VISUAL ด้วย CONDITIONAL FORMAT
  • POWER BI ตอนที่ 07: เริ่ม GET DATA ตั้งแต่ไฟล์ยังว่างเปล่า
  • POWER BI ตอนที่ 08: สร้าง DATA MODEL ที่เหมาะสม
  • POWER BI ตอนที่ 09: สร้าง DATE TABLE ด้วย DAX
  • POWER BI ตอนที่ 10: เรียนรู้ DAX เบื้องต้น
  • POWER BI ตอนที่ 11: เรียนรู้ DAX Table Function – FILTER
  • POWER BI ตอนที่ 12: DISTINCT, VALUES, ALL และผองเพื่อน
  • POWER BI ตอนที่ 13: CALCULATE ฟังก์ชันที่ทรงพลังที่สุดใน DAX
  • Power BI ตอนที่ 14: Context Transition และ พลังแฝงใน Measure
  • Power BI ตอนที่ 15: วิธีดึงค่าจาก Slicer มาคำนวณใน Report
  • Power BI ตอนที่ 16 : เดินทางข้ามเวลาไปกับ Time Intelligence DAX Function
  • Power BI ตอนที่ 17 : วิธีทำรายงานเทียบเป้าหมาย Target vs Actual
  • Power BI ตอนที่ 18 : วิธีการกระจายเป้า Allocate Target ด้วย DAX
  • Power BI ตอนที่ 19 : การปรับ Cross Filter Direction เพื่อคำนวณค่าในตาราง Dimension
  • ส่วนเสริม
  • การคำนวณต้นทุนแบบ FIFO ด้วย DAX
  • แสดงข้อมูลสรุปแบบ Top N + Others (ฉบับเทพเอ็กเซล)
  • การวิเคราะห์ Event ที่มีช่วงเวลาเริ่มต้นกับสิ้นสุดคนละวัน
  • เปรียบเทียบ MAX vs LASTDATE ในภาษา DAX

ใครสนใจอยากเรียนเป็นคลิปวีดีโอ ผมมีคอร์สออนไลน์ที่สอน Power BI ตั้งแต่พื้นฐาน สามารถไปดูรายละเอียดได้ที่นี่

This image has an empty alt attribute; its file name is Powerful-Data-Power-BI-1024x538.png
แชร์ความรู้ให้เพื่อนๆ ของคุณ
124    
124    

ติดตามเทพเอ็กเซล

  • Facebook
  • YouTube

อบรมกับเทพเอ็กเซล

🔥 คอร์สใหม่ล่าสุด 🔥

การทำ Optimization ด้วย Excel Solver
สำหรับงานวางแผน
คอร์สออนไลน์ เทพเอ็กเซล
คอร์สออนไลน์ จากเทพเอ็กเซล ดูกี่รอบก็ได้
อบรม Excel / Power BI ให้องค์กรของคุณ

บทความล่าสุด

  • แนวทางฝึกฝน Excel ให้เก่งขึ้น
  • รวม Link เว็บ/เพจเกี่ยวกับ AI
  • วิธีกำหนดท่าทางแบบให้ได้ดั่งใจด้วย ControlNet ใน Stable Diffusion [Part4]
  • วิธีสั่ง Prompt และตั้งค่าใน Stable Diffusion ให้รูปสวยโดนใจ [Part3]
  • วิธีเรียกใช้งาน Model เจ๋งๆ ใน Stable Diffusion [ตอนที่2]
  • วิธีใช้งาน AI สร้างรูปสุดเจ๋งและฟรีด้วย Stable Diffusion ฉบับมือใหม่ [ตอนที่1]
  • 10 ไอเดีย เรียนรู้ Excel ผ่าน ChatGPT AI สุดเจ๋ง

บทความแนะนำ

🔥ฟังก์ชันทั้งหมดใน Excel 🔥

  • แกะเคล็ดวิชา Excel Wizard ในการแข่ง Speed Run Excel ระดับโลก
  • เจาะลึก CALCULATE ใน DAX แบบลึกสุดใจ : Part 1
  • Series สอนดึงข้อมูลจากเว็บ ด้วย Power Automate Desktop
  • สรุปการใช้ LAMBDA ฟังก์ชันที่ใช้สร้างฟังก์ชันใน Excel 365 และผองเพื่อน
  • วิธีใช้ Excel คำนวณระยะเวลาการทำงานรวม แถมระบุเวลาพักได้แบบยืดหยุ่น
  • วิธีจัดการข้อมูลแย่ๆ ด้วย Power Query ทั้งข้อมูลปนกัน ข้อมูลอยู่บนหัวตาราง
  • แยกข้อมูลที่อยู่สุดเน่า ด้วย Excel Power Query

Categories

Tags

ai collection concepts copy database Data Model data validation date dax dropdown error excel filter finance find format formula function game graph IF index intro inventory len link logic lookup match m code merge mid overview paste pivot power query right row solver sort speed split substitute table text time tips trim vba vlookup

Archives

  • April 2023 (3)
  • March 2023 (2)
  • February 2023 (2)
  • January 2023 (1)
  • October 2022 (1)
  • September 2022 (3)
  • August 2022 (3)
  • July 2022 (1)
  • June 2022 (3)
  • May 2022 (1)
  • April 2022 (2)
  • February 2022 (1)
  • December 2021 (2)
  • November 2021 (10)
  • September 2021 (2)
  • August 2021 (6)
  • July 2021 (2)
  • June 2021 (2)
  • May 2021 (10)
  • April 2021 (3)
  • March 2021 (3)
  • February 2021 (4)
  • January 2021 (8)
  • December 2020 (5)
  • November 2020 (13)
  • October 2020 (5)
  • September 2020 (11)
  • August 2020 (4)
  • July 2020 (13)
  • June 2020 (17)
  • May 2020 (16)
  • April 2020 (16)
  • March 2020 (10)
  • February 2020 (15)
  • January 2020 (16)
  • December 2019 (4)
  • November 2019 (3)
  • October 2019 (9)
  • September 2019 (1)
  • August 2019 (7)
  • June 2019 (3)
  • May 2019 (9)
  • April 2019 (9)
  • March 2019 (2)
  • February 2018 (1)
  • January 2018 (3)
  • November 2017 (3)
  • August 2017 (1)
  • July 2017 (1)
  • June 2017 (1)
  • May 2017 (6)
  • April 2017 (6)
  • March 2017 (7)
  • February 2017 (1)
  • January 2017 (2)
  • December 2016 (1)
  • October 2016 (2)
  • September 2016 (3)
  • August 2016 (2)
  • July 2016 (2)
  • June 2016 (1)
  • May 2016 (1)
  • April 2016 (1)
  • March 2016 (2)
  • February 2016 (1)
  • January 2016 (2)
  • December 2015 (2)
  • November 2015 (5)
  • October 2015 (3)
  • June 2015 (2)
  • May 2015 (1)
  • April 2015 (26)
  • January 2015 (1)
  • December 2014 (1)
  • November 2014 (2)
  • October 2014 (1)
  • September 2014 (2)
  • August 2014 (1)
  • June 2014 (1)
  • May 2014 (1)
  • April 2014 (3)
  • March 2014 (3)
  • February 2014 (12)
  • January 2014 (7)
  • December 2013 (2)
  • November 2013 (8)
  • October 2013 (2)

เทพเอ็กเซล : Thep Excel

copyright © 2022

  • Facebook
  • YouTube
เว็บไซต์นี้ใช้คุกกี้ (Cookies)
บริษัท เทพเอ็กเซล จำกัด ให้ความสำคัญต่อข้อมูลส่วนบุคคลของท่าน เพื่อการพัฒนาและปรับปรุงเว็บไซต์รวมถึงสินค้าและบริการต่างๆ หากท่านใช้บริการเว็บไซต์นี้ โดยไม่มีการปรับตั้งค่าใดๆ แสดงว่าท่านยินยอมที่จะรับคุกกี้บนเว็บไซต์ และนโยบายสิทธิส่วนบุคคลของเรา
ตั้งค่าคุกกี้ยอมรับทั้งหมดอ่านเพิ่มเติม
Manage consent

Privacy Overview

This website uses cookies to improve your experience while you navigate through the website. Out of these, the cookies that are categorized as necessary are stored on your browser as they are essential for the working of basic functionalities of the website. We also use third-party cookies that help us analyze and understand how you use this website. These cookies will be stored in your browser only with your consent. You also have the option to opt-out of these cookies. But opting out of some of these cookies may affect your browsing experience.
Necessary
Always Enabled
Necessary cookies are absolutely essential for the website to function properly. These cookies ensure basic functionalities and security features of the website, anonymously.
CookieDurationDescription
cookielawinfo-checkbox-analytics11 monthsThis cookie is set by GDPR Cookie Consent plugin. The cookie is used to store the user consent for the cookies in the category "Analytics".
cookielawinfo-checkbox-functional11 monthsThe cookie is set by GDPR cookie consent to record the user consent for the cookies in the category "Functional".
cookielawinfo-checkbox-necessary11 monthsThis cookie is set by GDPR Cookie Consent plugin. The cookies is used to store the user consent for the cookies in the category "Necessary".
cookielawinfo-checkbox-others11 monthsThis cookie is set by GDPR Cookie Consent plugin. The cookie is used to store the user consent for the cookies in the category "Other.
cookielawinfo-checkbox-performance11 monthsThis cookie is set by GDPR Cookie Consent plugin. The cookie is used to store the user consent for the cookies in the category "Performance".
viewed_cookie_policy11 monthsThe cookie is set by the GDPR Cookie Consent plugin and is used to store whether or not user has consented to the use of cookies. It does not store any personal data.
Functional
Functional cookies help to perform certain functionalities like sharing the content of the website on social media platforms, collect feedbacks, and other third-party features.
Performance
Performance cookies are used to understand and analyze the key performance indexes of the website which helps in delivering a better user experience for the visitors.
Analytics
Analytical cookies are used to understand how visitors interact with the website. These cookies help provide information on metrics the number of visitors, bounce rate, traffic source, etc.
Advertisement
Advertisement cookies are used to provide visitors with relevant ads and marketing campaigns. These cookies track visitors across websites and collect information to provide customized ads.
Others
Other uncategorized cookies are those that are being analyzed and have not been classified into a category as yet.
SAVE & ACCEPT