ThepExcel Logo
  • บทความ
    • Excel
      • Excel ทั่วไป
      • Excel Pivot Table
      • Excel Power Pivot
      • Power Query
      • Excel Array Formula
      • Excel VBA
      • Excel for Business
      • Excel and Maths
      • ฟังก์ชัน Excel ทั้งหมด
    • Power BI
      • Power Query
      • Data Model
      • DAX Formula
      • Power BI Report
    • Coding
      • Excel VBA
      • Python
      • Power Query M Code
    • AI
      • ChatGPT
      • Stable Diffusion
      • MidJourney
    • Highlights : บทความแนะนำ
    • คลิปวีดีโอ
  • อบรม
    • อบรมลูกค้าองค์กร
    • คอร์สออนไลน์ SkillLane
    • แนะนำวิทยากร
    • Excel/Power BI Skill Map
    • Quiz
  • Shop
    • คอร์สออนไลน์
    • สินค้าทั้งหมด
    • หนังสือเล่ม
    • E-Book
    • Cart
  • Download
    • Download ไฟล์จากเทพเอ็กเซล
    • ThepExcel-Mfx : M Code สำเร็จรูป
    • Date Table สำเร็จรูป
    • กราฟ My Skill
    • github.com/ThepExcel
  • รวม Link
    • รวม Link สอน Excel & Power BI ทั้งไทยและเทศ
    • รวม Link เกี่ยวกับ AI
    • รวม Link Coding
    • หนังสือแนะนำ
    • Facebook ThepExcel
    • YouTube ThepExcel
    • DAX Formatter
  • Contact
    • แนะนำ เทพเอ็กเซล (Thep Excel)
    • แนะนำวิทยากร : อาจารย์ ศิระ เอกบุตร (ระ)
    • นโยบายการคุ้มครองข้อมูลส่วนบุคคล (Privacy Policy)
  • Facebook
  • YouTube

Power BI ตอนที่ 02: พื้นฐาน Excel ที่สำคัญก่อนจะเรียนรู้ Power BI

Categories 📂

Excel Pivot Table, Highlights : บทความแนะนำ, Power BI

Tags 🏷️

filter context, pivot

จะเข้าใจ Power BI ได้ พื้นฐาน Excel ที่สำคัญก่อนจะเรียนรู้ Power BI ในความคิดเห็นส่วนตัวของผมก็คือ เราควรจะมีความเข้าใจเรื่อง PivotTable ใน Excel ซะก่อน

ทั้งนี้เพราะพื้นฐานหลายๆ อย่างมันเหมือนกัน และการดูค่าใน Excel สามารถตรวจสอบผลลัพธ์ง่ายกว่า ดังนั้นผมจะขออธิบายการทำงานของ Pivot Table ใน Excel คร่าวๆ ก่อน เพื่อให้พวกเรามีพื้นฐานที่จำเป็นและมีความเข้าใจที่ถูกต้องว่ามันเกิดอะไรขึ้นกันแน่ใน PivotTable

สารบัญ

  • ข้อมูลตัวอย่าง
  • เรื่อง Basic ที่เราควรรู้คือ
  • ตัวอย่างการสรุปข้อมูลง่ายๆ
    • การตีความตัวเลขที่แสดงมา
    • Filter Context (บริบทการ Filter)
    • การเข้าใจ Filter Context จะทำให้เข้าใจวิธีการคำนวณดีขึ้น
    • ก่อนจะจากลา
  • สารบัญ Series Power BI

ข้อมูลตัวอย่าง

สมมติผมมีข้อมูลดิบเป็น Table อันนี้ แล้วเอาเข้าไปสรุปใน PivotTable โดยคลิ๊กที่ Table แล้วกด Insert Pivot Table แล้วกด ok

ข้อมูล 1 บรรทัดคือการขายของ 1 Transaction ซึ่งมีสินค้าได้ 1 ประเภท แต่สามารถขายได้หลายชิ้น ดังนั้นยอดขายต่อ Transaction จึงเท่ากับ ราคาต่อชิ้น * จำนวนชิ้น

เรื่อง Basic ที่เราควรรู้คือ

  • หัวตารางทุกอันจะกลายมาเป็น Field List ให้เราเลือก
  • ข้างใต้ Field List จะมีพื้นที่ 4 Block อยู่ หน้าที่เราคือลาก Field ลงมาที่ Block เหล่านั้น
  • หากลาก Field ที่มาที่ Value
    • กรณีเป็นตัวเลขจะเกิดการ Sum โดยอัตโนมัติ
    • กรณีเป็นข้อความจะเกิดการ Count โดยอัตโนมัติ
    • สามารถเปลี่ยนวิธีสรุปการคำนวณจาก Sum เป็นอย่างอื่นได้ ด้วยการคลิ๊กขวา Summarized Values By => Count, Average, Max, Min…
  • หากลาก Field ไปไว้ที่ Row มันจะมีการแจกแจงข้อมูลใน Field นั้นแบบไม่ซ้ำกันโดยแยกกันอยู่คนละแถว
  • หากลาก Field ไปไว้ที่ Column มันจะมีการแจกแจงข้อมูลใน Field นั้นแบบไม่ซ้ำกันโดยแยกกันอยู่คนละคอลัมน์
  • หากลาก Field ไปที่ Filter ก็จะสามารถ Filter ตามสิ่งที่ต้องการได้ ซึ่งจะส่งผลทั้งตาราง (อย่างไรก็ตามการลาก Field ไว้ที่ Row/Column ก็ Filter ได้เช่นกัน)

ตัวอย่างการสรุปข้อมูลง่ายๆ

สมมติว่าต้องการสรุปว่า Sales แต่ละคน ขายสินค้าแต่ละประเภท ได้ยอดขายรวมเฉพาะการชำระเงินแบบเงินสดรวมกี่บาท? สิ่งที่เราทำได้ คือ

  • ลากยอดขายไป Value (จะ Sum อัตโนมัติ)
  • ลากผู้ขายไปที่ Rows (จะแยกผู้ขายแบบไม่ซ้ำกันออกเป็นคนละแถว)
  • ลากสินค้าไปที่ Columns (จะแยกสินค้าแบบไม่ซ้ำกันเป็นคนละคอลัมน์)
  • ลากวิธีชำระเงินไป Filter แล้วเลือก เงินสด (จะสนใจเฉพาะข้อมูลแบบเงินสด)

การตีความตัวเลขที่แสดงมา

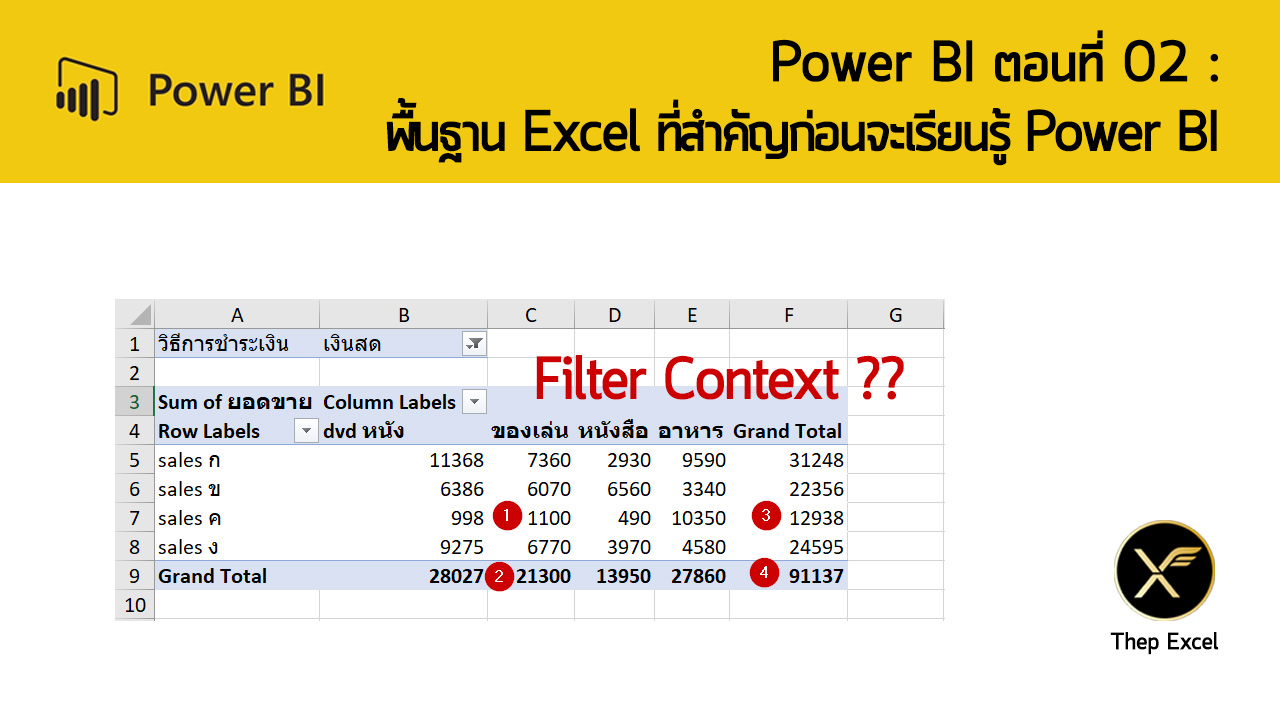
ตรง cell ที่ผมเลือกไว้ แปลว่า sales ค ขายของเล่น ด้วยวิธีชำระเงินแบบเงินสด ได้ยอดขายรวม 1100 บาท นี่คือการตีความเชิง Business

แต่วิธีที่ PivotTable คำนวณจริงๆ คือ เปรียบเสมือนว่ามันทำการ Filter ข้อมูล database ของเราให้ ผู้ขายเป็น sales ค, สินค้าเป็นของเล่น, วิธีชำระเงินเป็นเงินสด แล้วทำการ Sum ยอดขายได้ 1100 บาท ซึ่งเราสามารถพิสูจน์ได้โดยการดับเบิ้ลคลิ๊กเข้าไปที่เลข 1100 นั้น

จะเห็นว่ามันสร้าง sheet ใหม่โดย Filter ข้อมูลตามที่ผมบอกไปเลย แล้วค่อยทำการ Sum ยอดขายที่เหลือจากการ Filter ซึ่งจะได้ 1100 บาทพอดี

พูดง่ายๆ คือมัน Filter ให้ครบทุกมิติก่อน จากนั้นค่อยคำนวณตามวิธีที่ระบุใน Values จากนั้นจึงค่อยแสดงค่าออกมานั่นเอง ซึ่ง Concept นี้สำคัญสุดๆๆๆๆๆๆ !!!

Filter Context (บริบทการ Filter)

ดังนั้นแปลว่า ค่าแต่ละช่องของตาราง Pivot ที่แสดงออกมา จริงๆ แล้วการคำนวณมีเงื่อนไขการ Filter ไม่เหมือนกันเลยซักช่อง เช่น

  • ตำแหน่งเลข 1 คือ ผู้ขาย=sales ค, สินค้า=ของเล่น, วิธีชำระเงิน=เงินสด
  • ตำแหน่งเลข 2 คือ สินค้า=ของเล่น, วิธีชำระเงิน=เงินสด
  • ตำแหน่งเลข 3 คือ ผู้ขาย=sales ค, วิธีชำระเงิน=เงินสด
  • ตำแหน่งเลข 4 คือ วิธีชำระเงิน=เงินสด

การที่แต่ละช่องอยู่ภายใต้เงื่อนไขการ Filter ที่ต่างกัน เรียกว่ามี Filter Context ที่ต่างกัน ซึ่งคำว่า Filter Context นั้นเป็น Concept ที่สำคัญสุดๆของ Power BI แล้ว

การเข้าใจ Filter Context จะทำให้เข้าใจวิธีการคำนวณดีขึ้น

สมมติผมคำนวณยอดขายเฉลี่ย ของสินค้าแต่ละประเภท โดยเลือกยอดขายแล้วสั่งเปลี่ยนวิธีสรุป Summarized Values by Average แทนการ Sum จะได้ดังนี้

ถามว่าค่า Average ยอดขายของของเล่น 367.4528 แปลว่าอะไร? มันก็คือยอดขายเฉลี่ยต่อ 1 Transaction กรณีที่สินค้าคือของเล่นนั่นเอง (หรือพูดว่า Filter สินค้าเป็นของเล่น แล้วค่อยหาค่าเฉลี่ยยอดขาย) อันนี้ทุกคนน่าจะตอบได้

แต่ถ้าถามว่ายอดเฉลี่ยที่ Grand Total ที่แสดงออกมาเป็น 428.186 แปลว่าอะไร? หลายคนอาจจะตอบผิด!!

หากคุณคิดว่ามันคือเอายอดเฉลี่ยของสินค้าแต่ละอันมาเฉลี่ยกัน อันนี้ผิดแน่นอน เพราะถ้าทำแบบนั้นจริง มันจะต้องได้ 479.135 ต่างหาก

ความหมายของ ยอดเฉลี่ยที่ Grand Total 428.1866 แปลว่ายอดขายเฉลี่ยต่อ 1 Transaction กรณีที่ไม่ได้มีการ Filter สินค้าอะไรเลยต่างหากล่ะ!

เพราะการคำนวณที่ Grand Total (กรณีที่ไม่ได้มี Filter มาจากหัว Filter หรือ Slicer อื่น) แปลว่ามันไม่มี Filter อะไรอยู่เลย ดังนั้นเมื่อ Average ยอดขายจึงจะได้ 428.186

ก่อนจะจากลา

และนี่คือ Concept สำคัญที่จะทำให้เราเข้าใจการทำงานของการคำนวณใน Power BI มากขึ้น สำหรับบทความนี้ขอพอแค่นี้ก่อนดีกว่า เดี๋ยวไว้ต่อตอนหน้ากันครับ

เหมือนเดิม ใครมีคำถามอะไร ถามทิ้งไว้ได้เลย!!

สารบัญ Series Power BI

  • POWER BI ตอนที่ 01: POWER BI คืออะไร?
  • POWER BI ตอนที่ 02: พื้นฐาน EXCEL ที่สำคัญก่อนจะเรียนรู้ POWER BI
  • POWER BI ตอนที่ 03: ภาพรวมการใช้งาน POWER BI DESKTOP
  • POWER BI ตอนที่ 04: สร้าง REPORT แรก ใน POWER BI
  • POWER BI ตอนที่ 05: วิธีการ DRILL เพื่อเจาะลึกข้อมูลใน REPORT
  • POWER BI ตอนที่ 06: การปรับแต่งสีใน VISUAL ด้วย CONDITIONAL FORMAT
  • POWER BI ตอนที่ 07: เริ่ม GET DATA ตั้งแต่ไฟล์ยังว่างเปล่า
  • POWER BI ตอนที่ 08: สร้าง DATA MODEL ที่เหมาะสม
  • POWER BI ตอนที่ 09: สร้าง DATE TABLE ด้วย DAX
  • POWER BI ตอนที่ 10: เรียนรู้ DAX เบื้องต้น
  • POWER BI ตอนที่ 11: เรียนรู้ DAX Table Function – FILTER
  • POWER BI ตอนที่ 12: DISTINCT, VALUES, ALL และผองเพื่อน
  • POWER BI ตอนที่ 13: CALCULATE ฟังก์ชันที่ทรงพลังที่สุดใน DAX
  • Power BI ตอนที่ 14: Context Transition และ พลังแฝงใน Measure
  • Power BI ตอนที่ 15: วิธีดึงค่าจาก Slicer มาคำนวณใน Report
  • Power BI ตอนที่ 16 : เดินทางข้ามเวลาไปกับ Time Intelligence DAX Function
  • Power BI ตอนที่ 17 : วิธีทำรายงานเทียบเป้าหมาย Target vs Actual
  • Power BI ตอนที่ 18 : วิธีการกระจายเป้า Allocate Target ด้วย DAX
  • Power BI ตอนที่ 19 : การปรับ Cross Filter Direction เพื่อคำนวณค่าในตาราง Dimension
  • ส่วนเสริม
  • การคำนวณต้นทุนแบบ FIFO ด้วย DAX
  • แสดงข้อมูลสรุปแบบ Top N + Others (ฉบับเทพเอ็กเซล)
  • การวิเคราะห์ Event ที่มีช่วงเวลาเริ่มต้นกับสิ้นสุดคนละวัน
  • เปรียบเทียบ MAX vs LASTDATE ในภาษา DAX

ใครสนใจอยากเรียนเป็นคลิปวีดีโอ ผมมีคอร์สออนไลน์ที่สอน Power BI ตั้งแต่พื้นฐาน สามารถไปดูรายละเอียดได้ที่นี่

This image has an empty alt attribute; its file name is Powerful-Data-Power-BI-1024x538.png

แชร์ความรู้ให้เพื่อนๆ ของคุณ


ติดตามเทพเอ็กเซล

  • Facebook
  • YouTube

อบรมกับเทพเอ็กเซล

🔥 คอร์สใหม่ล่าสุด 🔥

การทำ Optimization ด้วย Excel Solver
สำหรับงานวางแผน
คอร์สออนไลน์ เทพเอ็กเซล
คอร์สออนไลน์ จากเทพเอ็กเซล ดูกี่รอบก็ได้
อบรม Excel / Power BI ให้องค์กรของคุณ

บทความล่าสุด

  • แนวทางฝึกฝน Excel ให้เก่งขึ้น
  • รวม Link เว็บ/เพจเกี่ยวกับ AI
  • วิธีกำหนดท่าทางแบบให้ได้ดั่งใจด้วย ControlNet ใน Stable Diffusion [Part4]
  • วิธีสั่ง Prompt และตั้งค่าใน Stable Diffusion ให้รูปสวยโดนใจ [Part3]
  • วิธีเรียกใช้งาน Model เจ๋งๆ ใน Stable Diffusion [ตอนที่2]
  • วิธีใช้งาน AI สร้างรูปสุดเจ๋งและฟรีด้วย Stable Diffusion ฉบับมือใหม่ [ตอนที่1]
  • 10 ไอเดีย เรียนรู้ Excel ผ่าน ChatGPT AI สุดเจ๋ง

บทความแนะนำ

🔥ฟังก์ชันทั้งหมดใน Excel 🔥

  • แกะเคล็ดวิชา Excel Wizard ในการแข่ง Speed Run Excel ระดับโลก
  • เจาะลึก CALCULATE ใน DAX แบบลึกสุดใจ : Part 1
  • Series สอนดึงข้อมูลจากเว็บ ด้วย Power Automate Desktop
  • สรุปการใช้ LAMBDA ฟังก์ชันที่ใช้สร้างฟังก์ชันใน Excel 365 และผองเพื่อน
  • วิธีใช้ Excel คำนวณระยะเวลาการทำงานรวม แถมระบุเวลาพักได้แบบยืดหยุ่น
  • วิธีจัดการข้อมูลแย่ๆ ด้วย Power Query ทั้งข้อมูลปนกัน ข้อมูลอยู่บนหัวตาราง
  • แยกข้อมูลที่อยู่สุดเน่า ด้วย Excel Power Query

Categories

Tags

ai collection concepts copy database Data Model data validation date dax dropdown error excel filter finance find format formula function game graph IF index intro inventory len link logic lookup match m code merge mid overview paste pivot power query right row solver sort speed split substitute table text time tips trim vba vlookup

Archives

  • April 2023 (3)
  • March 2023 (2)
  • February 2023 (2)
  • January 2023 (1)
  • October 2022 (1)
  • September 2022 (3)
  • August 2022 (3)
  • July 2022 (1)
  • June 2022 (3)
  • May 2022 (1)
  • April 2022 (2)
  • February 2022 (1)
  • December 2021 (2)
  • November 2021 (10)
  • September 2021 (2)
  • August 2021 (6)
  • July 2021 (2)
  • June 2021 (2)
  • May 2021 (10)
  • April 2021 (3)
  • March 2021 (3)
  • February 2021 (4)
  • January 2021 (8)
  • December 2020 (5)
  • November 2020 (13)
  • October 2020 (5)
  • September 2020 (11)
  • August 2020 (4)
  • July 2020 (13)
  • June 2020 (17)
  • May 2020 (16)
  • April 2020 (16)
  • March 2020 (10)
  • February 2020 (15)
  • January 2020 (16)
  • December 2019 (4)
  • November 2019 (3)
  • October 2019 (9)
  • September 2019 (1)
  • August 2019 (7)
  • June 2019 (3)
  • May 2019 (9)
  • April 2019 (9)
  • March 2019 (2)
  • February 2018 (1)
  • January 2018 (3)
  • November 2017 (3)
  • August 2017 (1)
  • July 2017 (1)
  • June 2017 (1)
  • May 2017 (6)
  • April 2017 (6)
  • March 2017 (7)
  • February 2017 (1)
  • January 2017 (2)
  • December 2016 (1)
  • October 2016 (2)
  • September 2016 (3)
  • August 2016 (2)
  • July 2016 (2)
  • June 2016 (1)
  • May 2016 (1)
  • April 2016 (1)
  • March 2016 (2)
  • February 2016 (1)
  • January 2016 (2)
  • December 2015 (2)
  • November 2015 (5)
  • October 2015 (3)
  • June 2015 (2)
  • May 2015 (1)
  • April 2015 (26)
  • January 2015 (1)
  • December 2014 (1)
  • November 2014 (2)
  • October 2014 (1)
  • September 2014 (2)
  • August 2014 (1)
  • June 2014 (1)
  • May 2014 (1)
  • April 2014 (3)
  • March 2014 (3)
  • February 2014 (12)
  • January 2014 (7)
  • December 2013 (2)
  • November 2013 (8)
  • October 2013 (2)

เทพเอ็กเซล : Thep Excel

copyright © 2022

  • Facebook
  • YouTube
เว็บไซต์นี้ใช้คุกกี้ (Cookies)
บริษัท เทพเอ็กเซล จำกัด ให้ความสำคัญต่อข้อมูลส่วนบุคคลของท่าน เพื่อการพัฒนาและปรับปรุงเว็บไซต์รวมถึงสินค้าและบริการต่างๆ หากท่านใช้บริการเว็บไซต์นี้ โดยไม่มีการปรับตั้งค่าใดๆ แสดงว่าท่านยินยอมที่จะรับคุกกี้บนเว็บไซต์ และนโยบายสิทธิส่วนบุคคลของเรา
ตั้งค่าคุกกี้ยอมรับทั้งหมดอ่านเพิ่มเติม
Manage consent

Privacy Overview

This website uses cookies to improve your experience while you navigate through the website. Out of these, the cookies that are categorized as necessary are stored on your browser as they are essential for the working of basic functionalities of the website. We also use third-party cookies that help us analyze and understand how you use this website. These cookies will be stored in your browser only with your consent. You also have the option to opt-out of these cookies. But opting out of some of these cookies may affect your browsing experience.
Necessary
Always Enabled
Necessary cookies are absolutely essential for the website to function properly. These cookies ensure basic functionalities and security features of the website, anonymously.
CookieDurationDescription
cookielawinfo-checkbox-analytics11 monthsThis cookie is set by GDPR Cookie Consent plugin. The cookie is used to store the user consent for the cookies in the category "Analytics".
cookielawinfo-checkbox-functional11 monthsThe cookie is set by GDPR cookie consent to record the user consent for the cookies in the category "Functional".
cookielawinfo-checkbox-necessary11 monthsThis cookie is set by GDPR Cookie Consent plugin. The cookies is used to store the user consent for the cookies in the category "Necessary".
cookielawinfo-checkbox-others11 monthsThis cookie is set by GDPR Cookie Consent plugin. The cookie is used to store the user consent for the cookies in the category "Other.
cookielawinfo-checkbox-performance11 monthsThis cookie is set by GDPR Cookie Consent plugin. The cookie is used to store the user consent for the cookies in the category "Performance".
viewed_cookie_policy11 monthsThe cookie is set by the GDPR Cookie Consent plugin and is used to store whether or not user has consented to the use of cookies. It does not store any personal data.
Functional
Functional cookies help to perform certain functionalities like sharing the content of the website on social media platforms, collect feedbacks, and other third-party features.
Performance
Performance cookies are used to understand and analyze the key performance indexes of the website which helps in delivering a better user experience for the visitors.
Analytics
Analytical cookies are used to understand how visitors interact with the website. These cookies help provide information on metrics the number of visitors, bounce rate, traffic source, etc.
Advertisement
Advertisement cookies are used to provide visitors with relevant ads and marketing campaigns. These cookies track visitors across websites and collect information to provide customized ads.
Others
Other uncategorized cookies are those that are being analyzed and have not been classified into a category as yet.
SAVE & ACCEPT